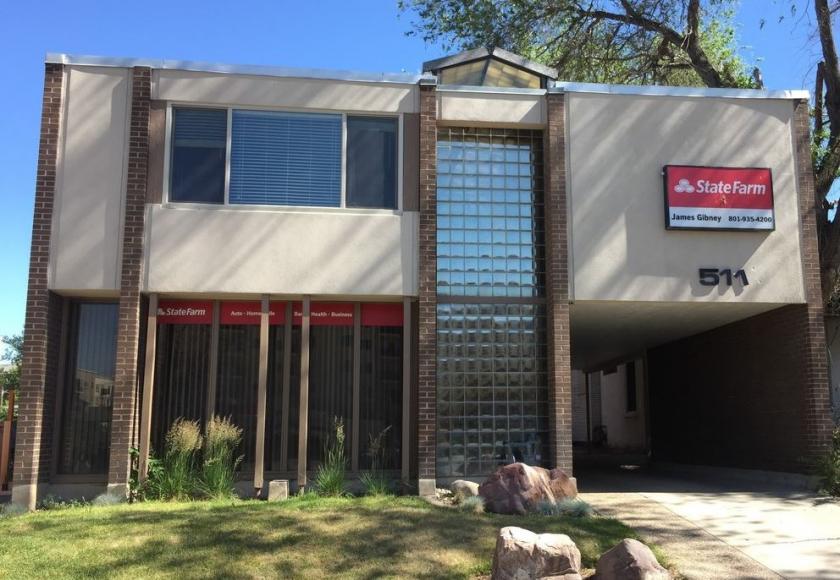
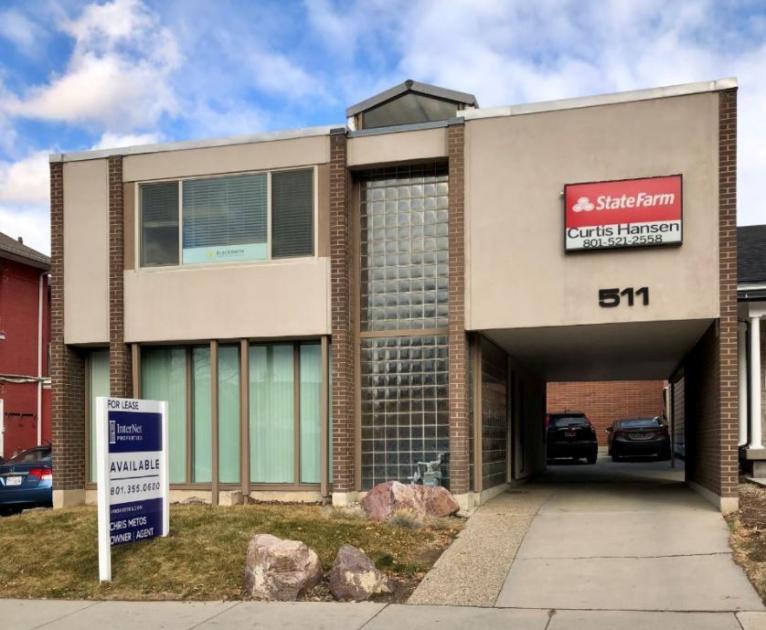
Office Space
511 East 300 South Salt Lake City, UT 84102
511 East 300 South Salt Lake City, UT 84102
Details & Description
Property Highlights
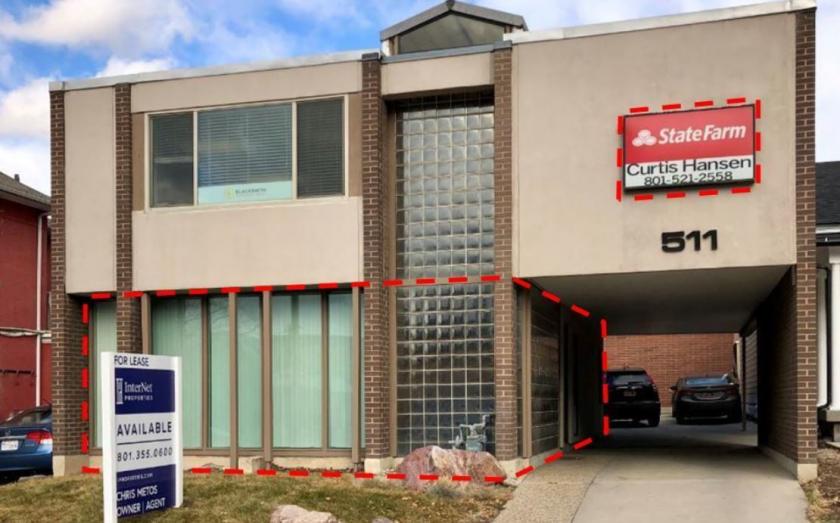
- • Rare Ground Level OfficeRetail Unit Available
- • Exterior Building Signage Included
- • Located Minutes from the Heart of Downtown
- • Surrounded by Many Amenities
- • One Block from 400 South TRAX Line
- • Mid-Century Modern Architecture
Listing Agents

Chris Metos
O: 801-879-7870
chris@iproperties.com
O: 801-879-7870
chris@iproperties.com
While we strive to provide the most accurate information, all listing information, and demographic data, is provided by third-parties. As such, MyEListing will not be responsible for the accuracy of the information. It is strongly recommended that you verify all information with the listing agent, and any relevant agencies, prior to making any decisions.