Office Space
165 South Main Street Salt Lake City, UT 84111
165 South Main Street Salt Lake City, UT 84111
Details & Description
Property Highlights
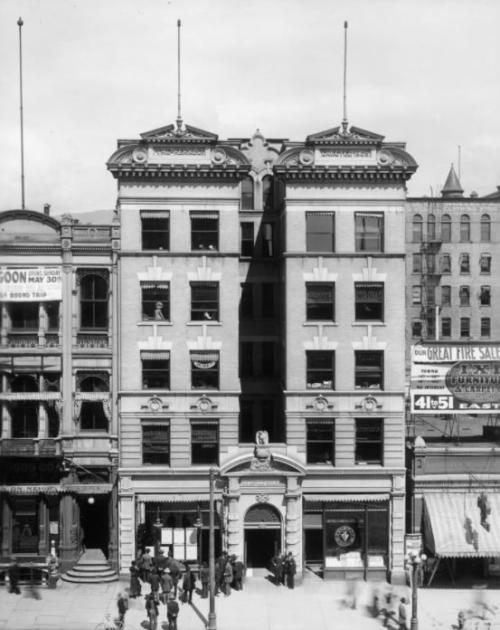
- • Interior atrium skylight adds light to all floors.
- • No load factor.
- • Three Pines Coffee Shop Located in the Building.
Additional Photos


Listing Agents

Nico Priskos
O: 801-413-8902
nico@iproperties.com
O: 801-413-8902
nico@iproperties.com
While we strive to provide the most accurate information, all listing information, and demographic data, is provided by third-parties. As such, MyEListing will not be responsible for the accuracy of the information. It is strongly recommended that you verify all information with the listing agent, and any relevant agencies, prior to making any decisions.


