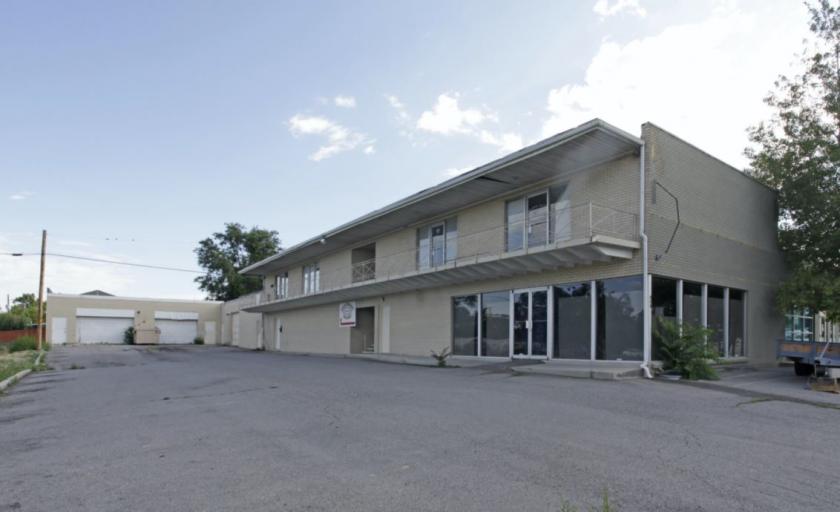
Commercial Land
959 East 3300 South Salt Lake City, UT 84106
959 East 3300 South Salt Lake City, UT 84106
Details & Description
Property Highlights
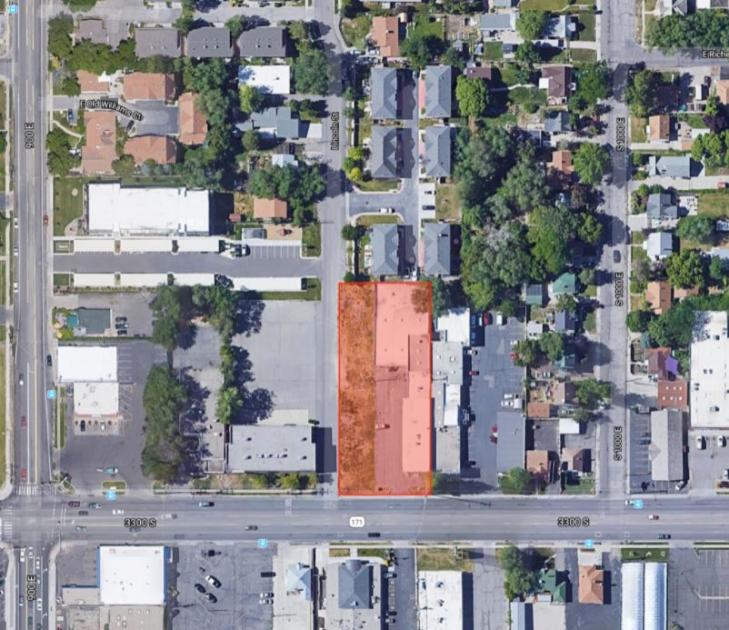
- • 0.81 Acres
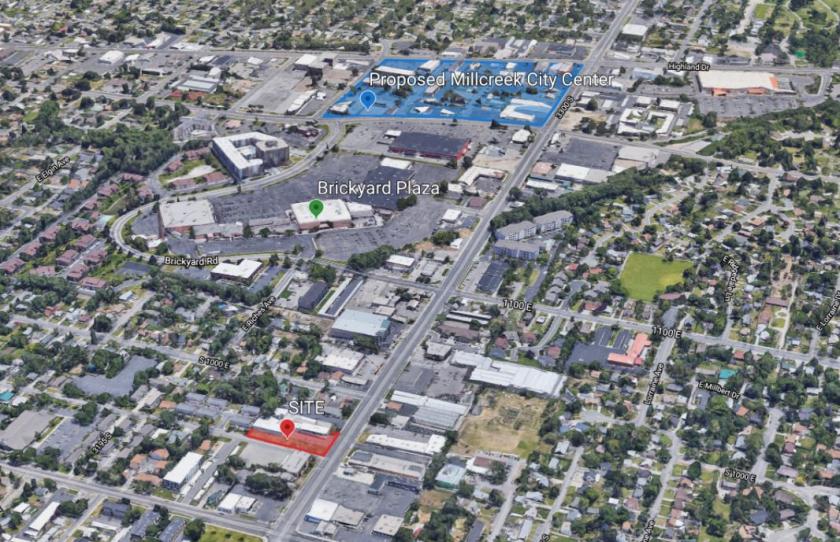
- • Located within an Opportunity Zone
- • Soft Corner Location with High Traffic Counts
- • Currently Zoned C-2
Listing Agents

Nico Priskos
O: 801-413-8902
nico@iproperties.com
O: 801-413-8902
nico@iproperties.com
While we strive to provide the most accurate information, all listing information, and demographic data, is provided by third-parties. As such, MyEListing will not be responsible for the accuracy of the information. It is strongly recommended that you verify all information with the listing agent, and any relevant agencies, prior to making any decisions.