Industrial Properties
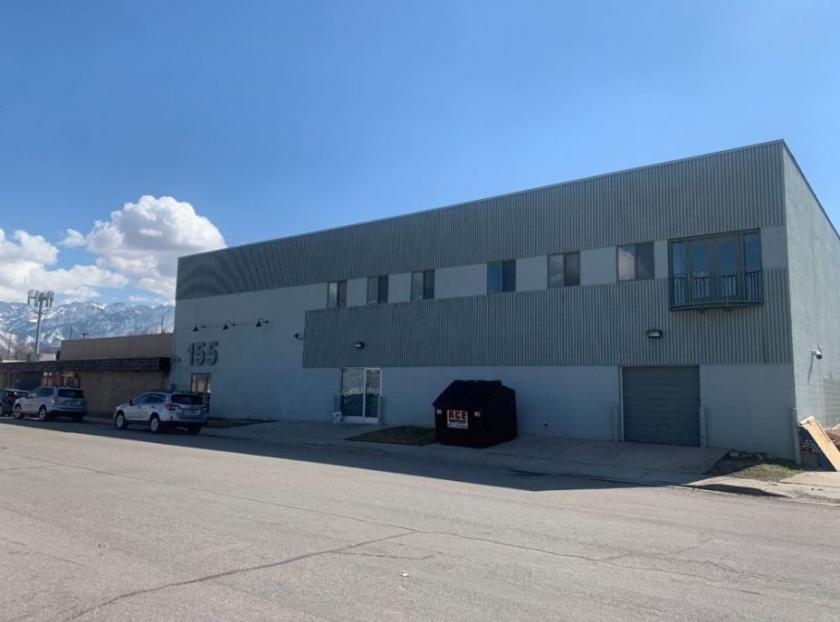
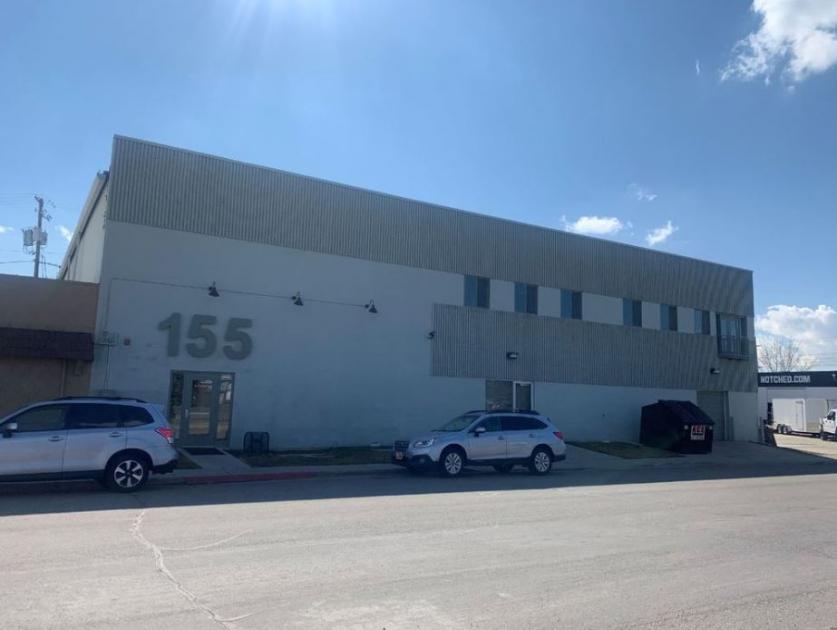
155 West Malvern Avenue South Salt Lake, UT 84115
155 West Malvern Avenue South Salt Lake, UT 84115
Details & Description
Property Highlights
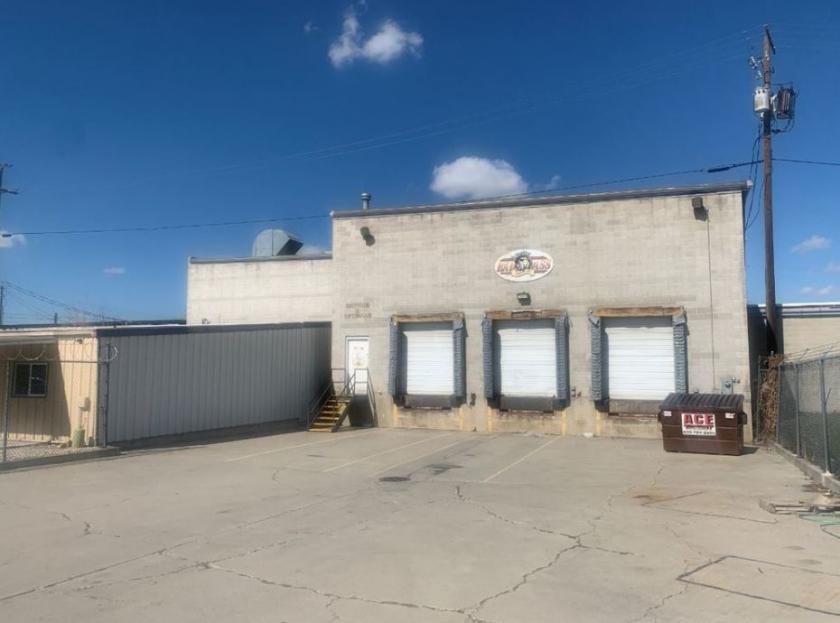
- • 3 8 x 8 Dock High Doors
- • Clear Height Ranging from 12-20 Average Approx. 13
- • Partial Office Buildout
- • Zoned CG
Listing Agents

Nico Priskos
O: 801-413-8902
nico@iproperties.com
O: 801-413-8902
nico@iproperties.com
While we strive to provide the most accurate information, all listing information, and demographic data, is provided by third-parties. As such, MyEListing will not be responsible for the accuracy of the information. It is strongly recommended that you verify all information with the listing agent, and any relevant agencies, prior to making any decisions.