Commercial Land
2100 - 2120 West 92nd Avenue Federal Heights, CO 80260
2100 - 2120 West 92nd Avenue Federal Heights, CO 80260
Details & Description
Property Highlights
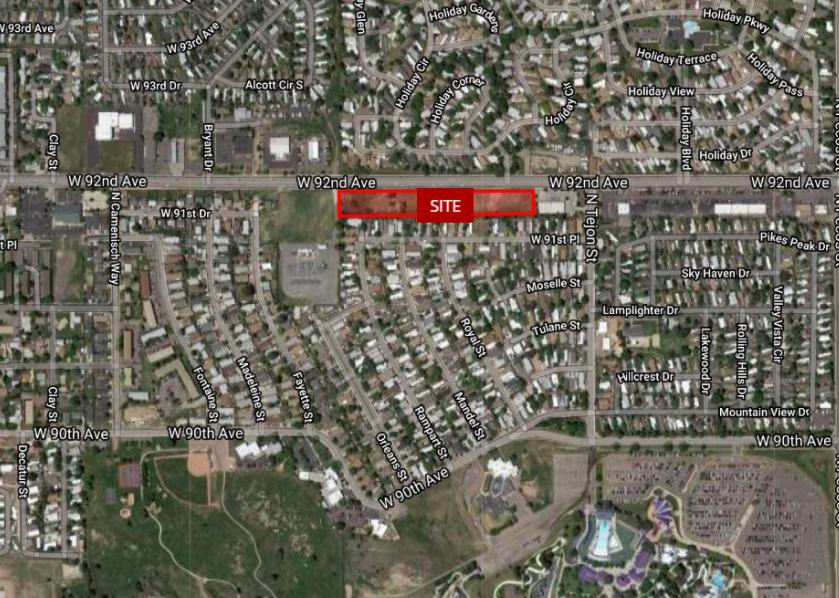
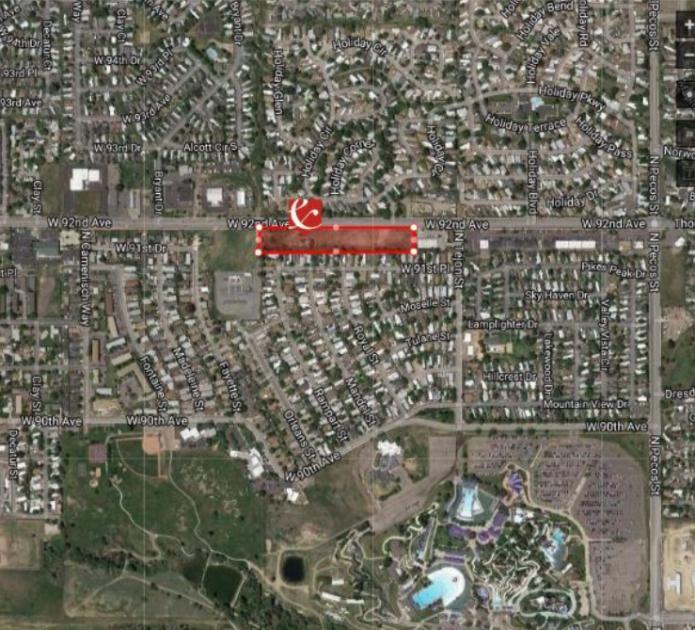
- • Great retail development location - 3.44 acres
- • Along busy 92nd Ave. between Pecos Federal
- • Strong daily traffic counts
Listing Agents

Tom Bevans
O: 303-454-5421
tbevans@antonoff.com
O: 303-454-5421
tbevans@antonoff.com
While we strive to provide the most accurate information, all listing information, and demographic data, is provided by third-parties. As such, MyEListing will not be responsible for the accuracy of the information. It is strongly recommended that you verify all information with the listing agent, and any relevant agencies, prior to making any decisions.