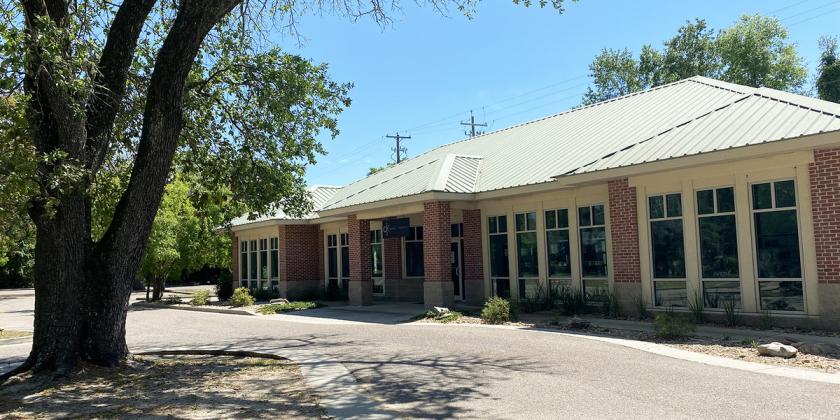
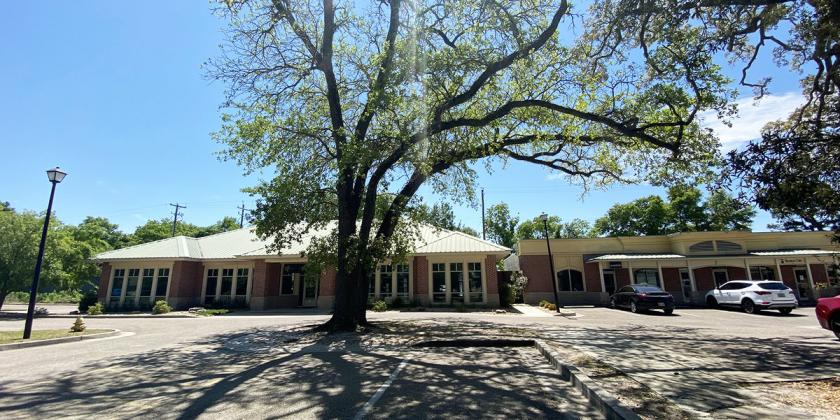
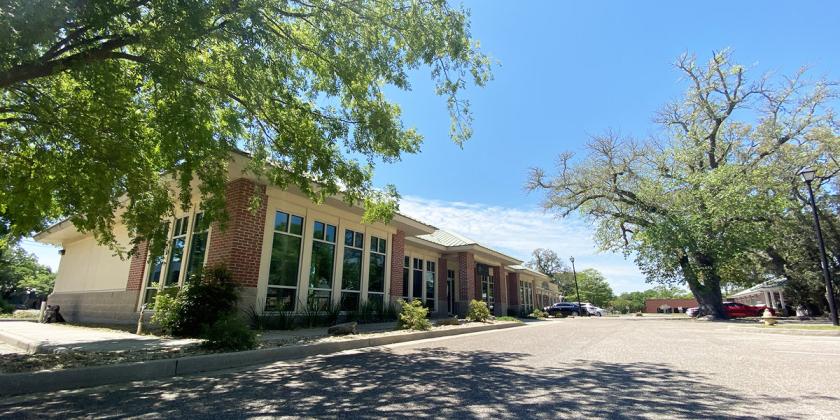
1-Mile | 3-Miles | 5-Miles | ||
---|---|---|---|---|
Total Population | 3,922 | 30,353 | 66,950 | |
Population Median Age | 43 | 40 | 39 | |
Population by Age | 0-9 Yrs | 355 (9%) | 3109 (10%) | 7609 (11%) |
10-19 Yrs | 318 (8%) | 3809 (12%) | 8391 (12%) | |
20-29 Yrs | 591 (15%) | 4559 (15%) | 10439 (15%) | |
30-39 Yrs | 484 (12%) | 3860 (12%) | 9300 (13%) | |
40-49 Yrs | 358 (9%) | 3245 (10%) | 7604 (11%) | |
50-59 Yrs | 818 (20%) | 4423 (14%) | 9165 (13%) | |
60-69 Yrs | 580 (14%) | 3872 (12%) | 7680 (11%) | |
70+ Yrs | 420 (10%) | 3476 (11%) | 6762 (10%) | |
Median HH Income | $32,500 | $41,101 | $40,199 | |
Total Household Income | < 24K | 825 (43%) | 4385 (32%) | 9555 (34%) |
25-49K | 397 (20%) | 3581 (26%) | 6926 (24%) | |
50-74K | 309 (16%) | 2466 (18%) | 5194 (18%) | |
75-99K | 140 (7%) | 1264 (9%) | 2731 (9%) | |
100-199K | 225 (11%) | 1464 (10%) | 2736 (9%) | |
200K+ | 1 (0%) | 433 (3%) | 797 (2%) | |
Highest Education Level | No Diploma | 273 | 2208 | 5524 |
Diploma or GED | 1043 | 5850 | 14016 | |
Some College | 652 | 5299 | 11163 | |
Assoc. Degree | 338 | 1997 | 4420 | |
Bachelors Degree | 500 | 3875 | 7390 | |
Higher Degree | 246 | 2168 | 3984 | |
Total Housing Units | 2,662 | 17,213 | 35,191 | |
--Owner-Occupied | 829 | 6,123 | 12,591 | |
--Renter-Occupied | 1,069 | 7,471 | 15,348 | |
Owner-Occupied Values | < 100K | 220 | 1478 | 4156 |
100-199K | 317 | 2388 | 4842 | |
200-299K | 226 | 1369 | 2177 | |
300-399K | 32 | 284 | 526 | |
400-499K | 32 | 364 | 465 | |
500K+ | 2 | 240 | 425 | |
Total Working Age Population | 3,362 | 24,633 | 53,942 | |
In Work Force | 1,884 | 14,188 | 31,679 | |
Not In Work Force | 1,478 | 10,445 | 22,262 | |
Workforce Employed | 1,478 | 12,229 | 27,155 | |
Workforce Unemployed | 310 | 1,564 | 3,428 | |
Civlian Workforce | 1,788 | 13,793 | 30,583 | |
Military Workforce | 96 | 395 | 1,097 | |
Total Households | 1,897 | 13,594 | 27,939 | |
Family Households | 1,026 | 7,563 | 16,345 | |
Non-Family Households | 871 | 6,031 | 11,594 | |
Married Couple | 445 | 4,351 | 9,541 | |
Other Family | 581 | 3,212 | 6,805 | |
Married w/Child | 108 | 1,260 | 3,188 | |
Single Male w/Child | 68 | 519 | 879 | |
Single Female w/Child | 200 | 1,268 | 3,088 |
Population Change Last Two Decades - Plus Projection
2000 | % | 2010 | % | 2020 | % | 2030 | |
---|---|---|---|---|---|---|---|
Mississippi | 2,844,658 | +4 | 2,967,297 | +3 | 3,066,382 | +1 | 3,104,159 |
Harrison County | 189,601 | -1 | 187,105 | +8 | 201,185 | +1 | 203,664 |
Total Working Age Population:
Total Households:
Total Working Age Population:
Total Households:
Total Working Age Population:
Total Households: