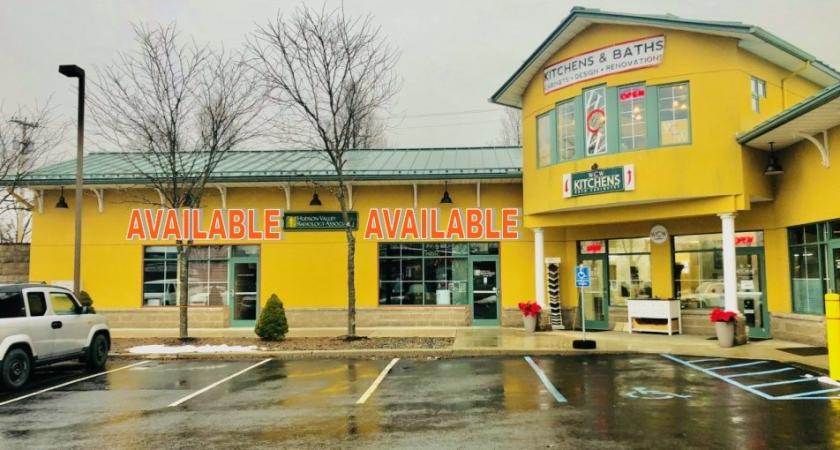
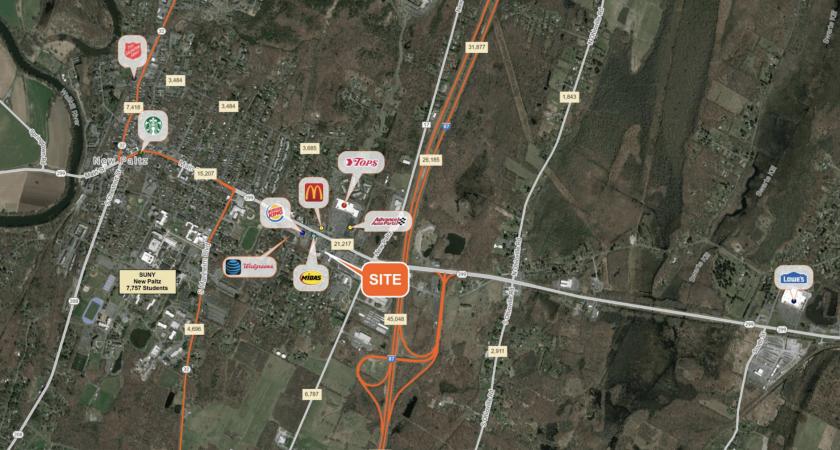
1-Mile | 3-Miles | 5-Miles | ||
---|---|---|---|---|
Total Population | 6,803 | 14,136 | 22,782 | |
Population Median Age | 29 | 35 | 39 | |
Population by Age | 0-9 Yrs | 511 (7%) | 1084 (7%) | 1700 (7%) |
10-19 Yrs | 1656 (24%) | 2752 (19%) | 3763 (16%) | |
20-29 Yrs | 2787 (40%) | 4034 (28%) | 4862 (21%) | |
30-39 Yrs | 336 (4%) | 1001 (7%) | 1791 (7%) | |
40-49 Yrs | 435 (6%) | 1217 (8%) | 2321 (10%) | |
50-59 Yrs | 269 (3%) | 1416 (10%) | 3321 (14%) | |
60-69 Yrs | 297 (4%) | 1231 (8%) | 2428 (10%) | |
70+ Yrs | 513 (7%) | 1402 (9%) | 2597 (11%) | |
Median HH Income | $53,725 | $72,429 | $73,568 | |
Total Household Income | < 24K | 504 (28%) | 900 (19%) | 1378 (16%) |
25-49K | 338 (19%) | 760 (16%) | 1374 (16%) | |
50-74K | 267 (15%) | 665 (14%) | 1403 (17%) | |
75-99K | 247 (13%) | 650 (14%) | 1189 (14%) | |
100-199K | 338 (19%) | 1198 (26%) | 2189 (26%) | |
200K+ | 81 (4%) | 362 (7%) | 643 (7%) | |
Highest Education Level | No Diploma | 86 | 241 | 680 |
Diploma or GED | 313 | 1184 | 2936 | |
Some College | 292 | 1025 | 2215 | |
Assoc. Degree | 172 | 572 | 1221 | |
Bachelors Degree | 538 | 1639 | 2963 | |
Higher Degree | 896 | 2410 | 3629 | |
Total Housing Units | 2,052 | 5,237 | 9,359 | |
--Owner-Occupied | 625 | 2,433 | 5,246 | |
--Renter-Occupied | 1,150 | 2,102 | 2,930 | |
Owner-Occupied Values | < 100K | 14 | 43 | 484 |
100-199K | 79 | 317 | 778 | |
200-299K | 248 | 899 | 1842 | |
300-399K | 136 | 576 | 986 | |
400-499K | 85 | 403 | 656 | |
500K+ | 63 | 195 | 501 | |
Total Working Age Population | 6,110 | 12,342 | 19,753 | |
In Work Force | 3,333 | 7,191 | 12,019 | |
Not In Work Force | 2,777 | 5,151 | 7,734 | |
Workforce Employed | 3,043 | 6,694 | 11,327 | |
Workforce Unemployed | 290 | 498 | 689 | |
Civlian Workforce | 3,333 | 7,191 | 12,016 | |
Military Workforce | 0 | 0 | 2 | |
Total Households | 1,775 | 4,535 | 8,176 | |
Family Households | 711 | 2,411 | 4,619 | |
Non-Family Households | 1,064 | 2,124 | 3,557 | |
Married Couple | 521 | 1,909 | 3,744 | |
Other Family | 190 | 502 | 875 | |
Married w/Child | 196 | 687 | 1,360 | |
Single Male w/Child | 20 | 92 | 152 | |
Single Female w/Child | 128 | 253 | 344 |
Population Change Last Two Decades - Plus Projection
2000 | % | 2010 | % | 2020 | % | 2030 | |
---|---|---|---|---|---|---|---|
New York | 18,976,457 | +2 | 19,378,102 | +4 | 20,146,131 | +2 | 20,604,030 |
Dutchess County | 280,150 | +6 | 297,488 | -2 | 292,936 | -1 | 290,338 |
Ulster County | 177,749 | +3 | 182,493 | -2 | 179,009 | -1 | 176,893 |
Total Working Age Population:
Total Households:
Total Working Age Population:
Total Households:
Total Working Age Population:
Total Households: