Commercial Land
2661 U.S. 9 Cold Spring, NY 10516
2661 U.S. 9 Cold Spring, NY 10516
Details & Description
Property Highlights
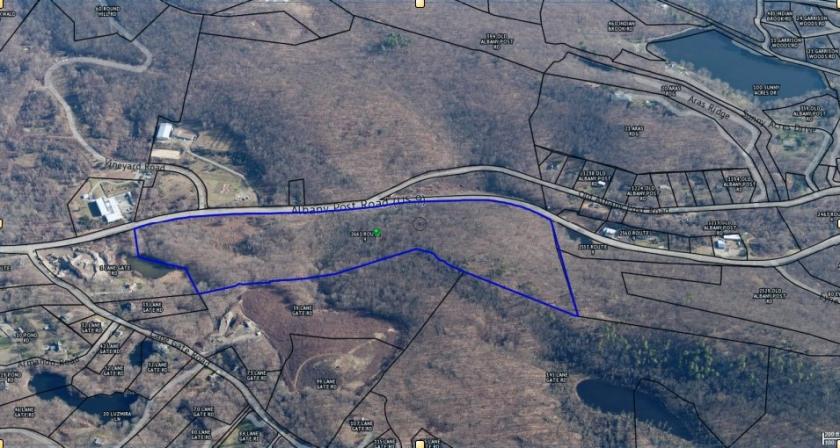
- • 47.25 acres
- • Extensive Road Frontage
- • Ripe for investment
- • Development opportunity
- • Agricultural, commercial or residential use
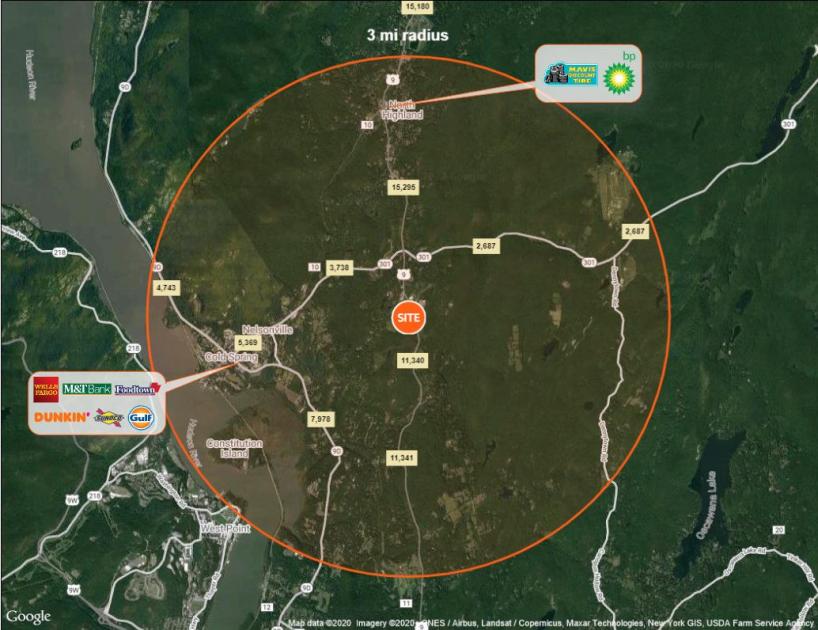
- • Heavy traffic counts
Listing Agents

Marc Pisanelli
O: 845-216-0118
mpisaneli@caliberbrokerage.com
O: 845-216-0118
mpisaneli@caliberbrokerage.com
While we strive to provide the most accurate information, all listing information, and demographic data, is provided by third-parties. As such, MyEListing will not be responsible for the accuracy of the information. It is strongly recommended that you verify all information with the listing agent, and any relevant agencies, prior to making any decisions.