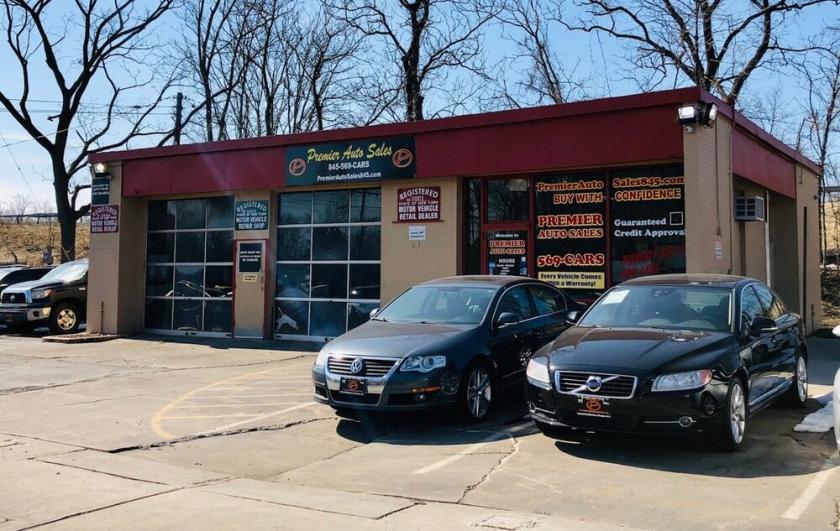
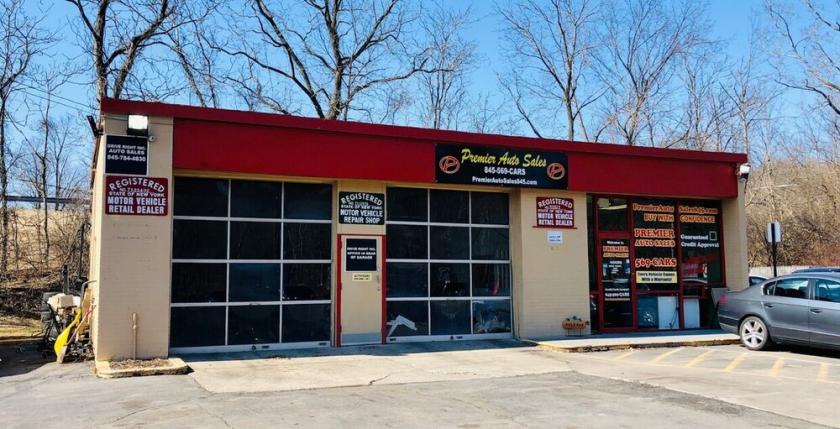
1-Mile | 3-Miles | 5-Miles | ||
---|---|---|---|---|
Total Population | 2,986 | 34,649 | 96,138 | |
Population Median Age | 39 | 39 | 38 | |
Population by Age | 0-9 Yrs | 410 (13%) | 4098 (11%) | 12111 (12%) |
10-19 Yrs | 439 (14%) | 5208 (15%) | 13182 (13%) | |
20-29 Yrs | 221 (7%) | 4056 (11%) | 13288 (13%) | |
30-39 Yrs | 392 (13%) | 4733 (13%) | 12791 (13%) | |
40-49 Yrs | 435 (14%) | 4491 (12%) | 11839 (12%) | |
50-59 Yrs | 446 (14%) | 4604 (13%) | 13021 (13%) | |
60-69 Yrs | 353 (11%) | 3625 (10%) | 10645 (11%) | |
70+ Yrs | 290 (9%) | 3832 (11%) | 9260 (9%) | |
Median HH Income | $77,240 | $73,085 | $68,042 | |
Total Household Income | < 24K | 116 (11%) | 2228 (17%) | 6518 (18%) |
25-49K | 196 (18%) | 2317 (18%) | 7441 (21%) | |
50-74K | 190 (18%) | 1874 (14%) | 5192 (14%) | |
75-99K | 168 (16%) | 1804 (14%) | 4379 (12%) | |
100-199K | 273 (26%) | 3451 (27%) | 9195 (26%) | |
200K+ | 91 (8%) | 860 (6%) | 2546 (7%) | |
Highest Education Level | No Diploma | 146 | 2433 | 7444 |
Diploma or GED | 545 | 7503 | 19070 | |
Some College | 491 | 4530 | 12104 | |
Assoc. Degree | 226 | 2447 | 6335 | |
Bachelors Degree | 341 | 3833 | 10879 | |
Higher Degree | 270 | 2689 | 8021 | |
Total Housing Units | 1,056 | 13,643 | 40,219 | |
--Owner-Occupied | 884 | 8,524 | 21,018 | |
--Renter-Occupied | 151 | 4,011 | 14,254 | |
Owner-Occupied Values | < 100K | 179 | 896 | 1931 |
100-199K | 166 | 2260 | 4927 | |
200-299K | 301 | 3037 | 7515 | |
300-399K | 157 | 1367 | 3871 | |
400-499K | 66 | 716 | 1784 | |
500K+ | 16 | 248 | 990 | |
Total Working Age Population | 2,391 | 27,543 | 76,359 | |
In Work Force | 1,679 | 18,200 | 50,361 | |
Not In Work Force | 711 | 9,343 | 25,998 | |
Workforce Employed | 1,498 | 17,025 | 47,287 | |
Workforce Unemployed | 131 | 809 | 2,545 | |
Civlian Workforce | 1,628 | 17,834 | 49,831 | |
Military Workforce | 51 | 366 | 529 | |
Total Households | 1,034 | 12,535 | 35,272 | |
Family Households | 735 | 8,193 | 22,875 | |
Non-Family Households | 299 | 4,342 | 12,396 | |
Married Couple | 529 | 6,039 | 15,531 | |
Other Family | 206 | 2,154 | 7,345 | |
Married w/Child | 210 | 2,736 | 6,434 | |
Single Male w/Child | 63 | 230 | 895 | |
Single Female w/Child | 43 | 845 | 3,256 |
Population Change Last Two Decades - Plus Projection
2000 | % | 2010 | % | 2020 | % | 2030 | |
---|---|---|---|---|---|---|---|
New York | 18,976,457 | +2 | 19,378,102 | +4 | 20,146,131 | +2 | 20,604,030 |
Dutchess County | 280,150 | +6 | 297,488 | -2 | 292,936 | -1 | 290,338 |
Orange County | 341,367 | +9 | 372,813 | +3 | 384,125 | +4 | 397,598 |
Putnam County | 95,745 | +4 | 99,710 | 0 | 99,274 | +1 | 100,199 |
Total Working Age Population:
Total Households:
Total Working Age Population:
Total Households:
Total Working Age Population:
Total Households: