Retail Space
31301 Harper Avenue St Clair Shores, MI 48082
31301 Harper Avenue St Clair Shores, MI 48082
Details & Description
Property Highlights
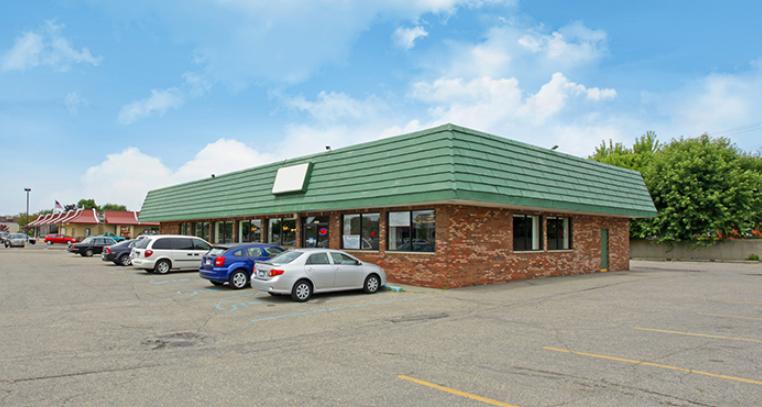
- • Former restaurant site situated on .83 acres
- • Drive-thru permitted
- • Ample parking
- • Adjacent to newly remodeled McDonalds
- • Pylon signage
- • Two points of ingressegress
Listing Agents

Louis Ciotti
O: 248-488-2620
lciotti@landmarkcres.com
O: 248-488-2620
lciotti@landmarkcres.com
While we strive to provide the most accurate information, all listing information, and demographic data, is provided by third-parties. As such, MyEListing will not be responsible for the accuracy of the information. It is strongly recommended that you verify all information with the listing agent, and any relevant agencies, prior to making any decisions.


