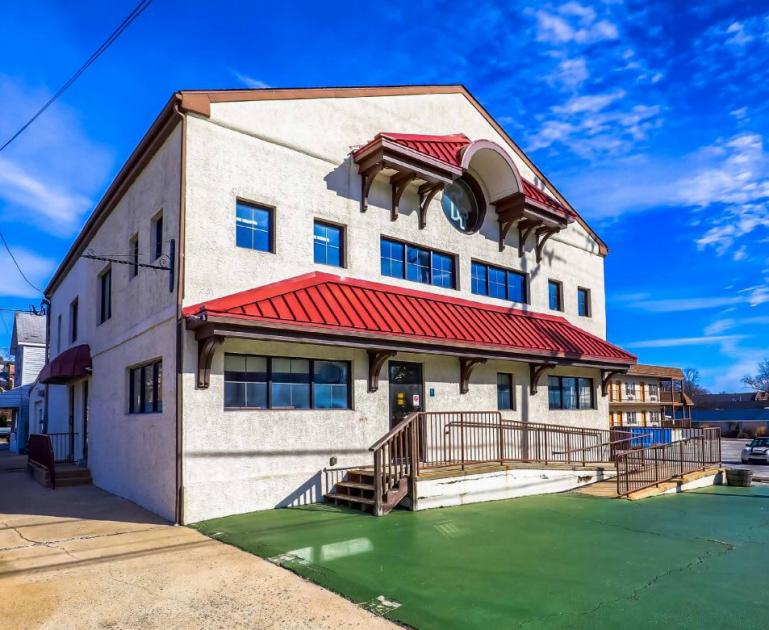
Retail Space
201 Birch Street Kennett Square, PA 19348
201 Birch Street Kennett Square, PA 19348
Details & Description
Property Highlights
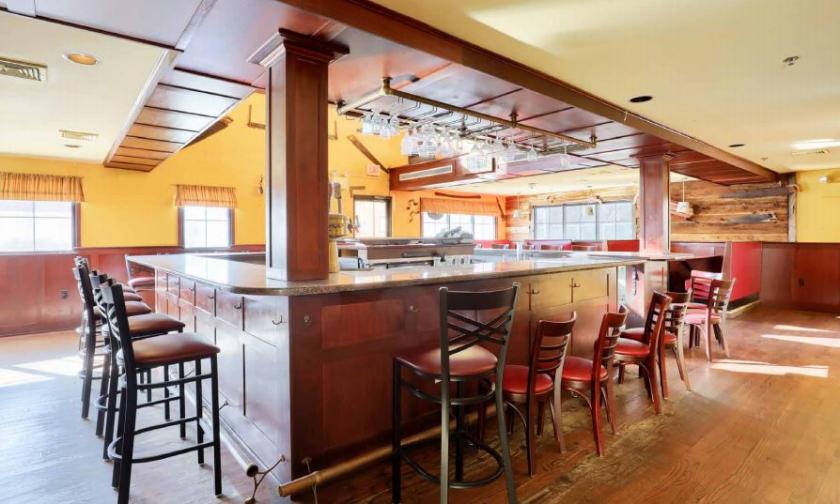
- • Liquor License Available
- • Large Kitchen Area
- • On Site Parking
- • Seating For 150
- • Large Outdoor Area
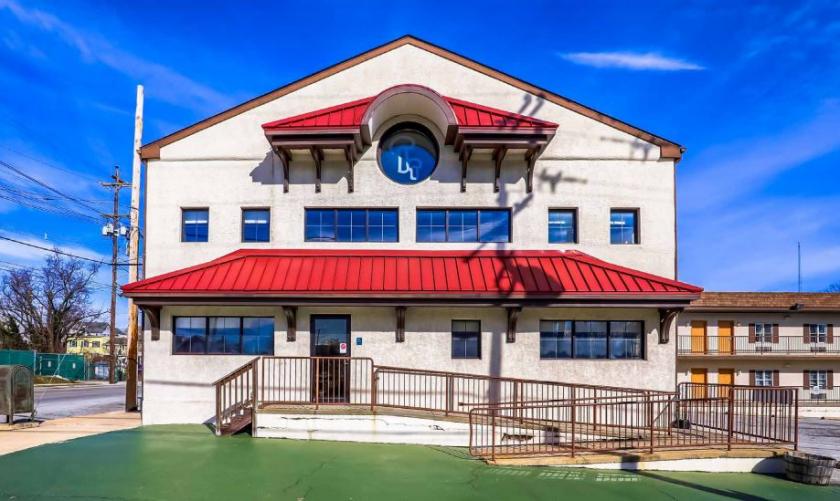
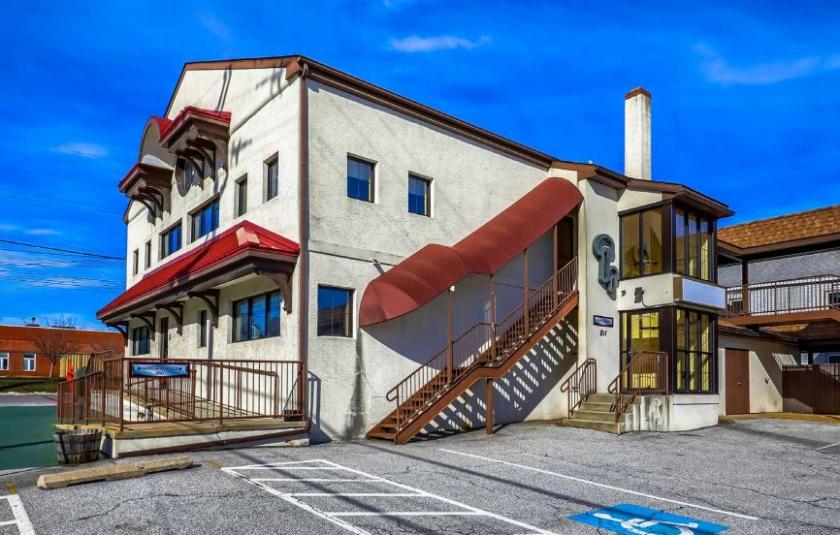
Additional Photos

Listing Agents

Tess Scott
O: 610-359-1100
M: 610-401-3453
tscott@zmcre.com
O: 610-359-1100
M: 610-401-3453
tscott@zmcre.com
While we strive to provide the most accurate information, all listing information, and demographic data, is provided by third-parties. As such, MyEListing will not be responsible for the accuracy of the information. It is strongly recommended that you verify all information with the listing agent, and any relevant agencies, prior to making any decisions.


