Specialty Real Estate
4690 Main Street Honey Brook, PA 19344
4690 Main Street Honey Brook, PA 19344

Details & Description
Property Highlights
- • Lots of outdoor space and large patio with seating
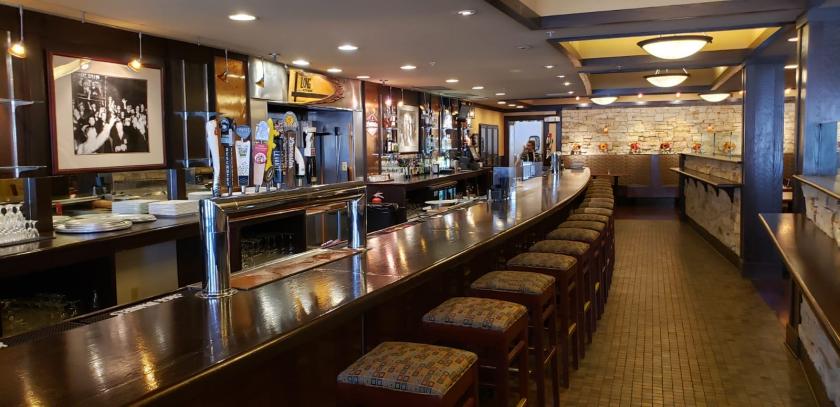
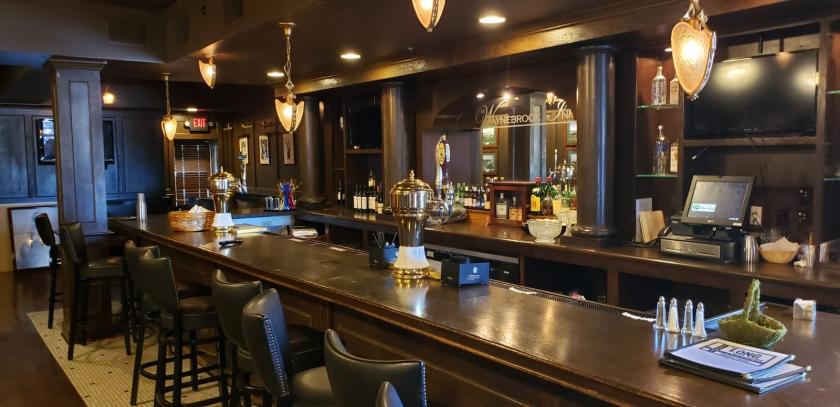
- • 60 Seat Pub Room
- • 50 Seat Club Room
- • 21 Room Hotel
- • Includes Hotel Liquor License
- • Private Parking Lot
Additional Photos

Listing Agents

Tess Scott
O: 610-359-1100
M: 610-401-3453
tscott@zmcre.com
O: 610-359-1100
M: 610-401-3453
tscott@zmcre.com
While we strive to provide the most accurate information, all listing information, and demographic data, is provided by third-parties. As such, MyEListing will not be responsible for the accuracy of the information. It is strongly recommended that you verify all information with the listing agent, and any relevant agencies, prior to making any decisions.


