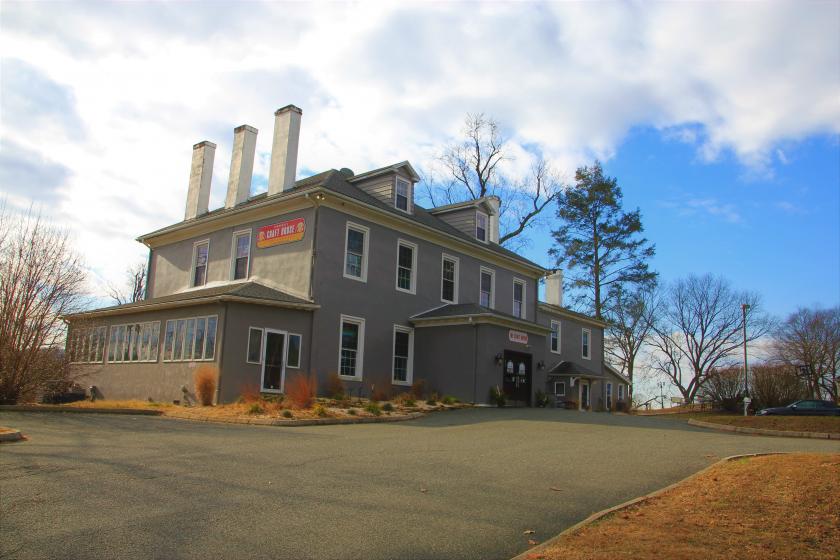
Retail Space
300 North Bailey Road Thorndale, PA 19372
300 North Bailey Road Thorndale, PA 19372
Details & Description
Property Highlights
- • Building can be subdivided
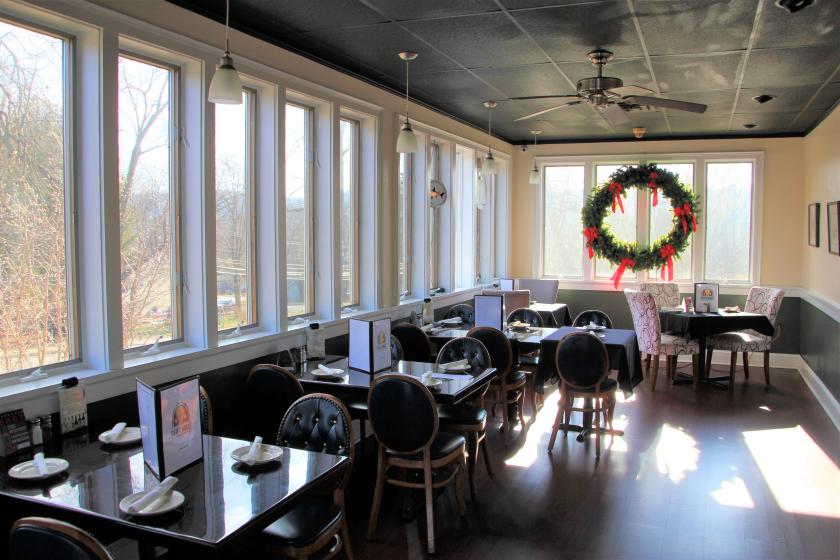
- • Approx. 234 Seats
- • 90 Parking Spaces Plenty of Outdoor Space
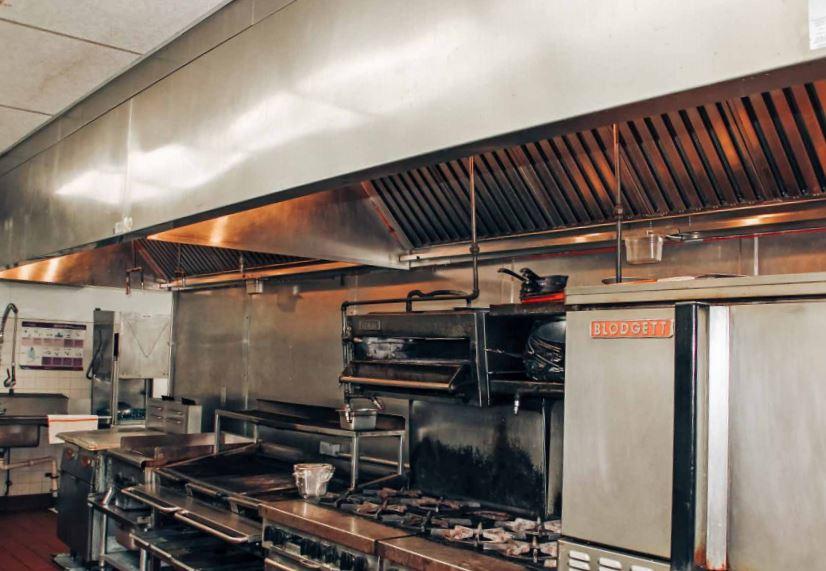
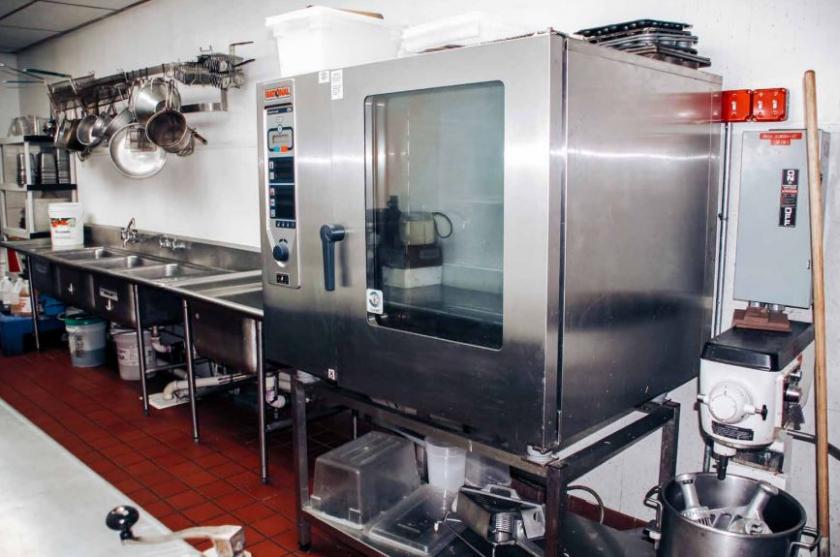
- • All FFE Included
- • Chester County R Liquor License Included
Additional Photos

Listing Agents

Tess Scott
O: 610-359-1100
M: 610-401-3453
tscott@zmcre.com
O: 610-359-1100
M: 610-401-3453
tscott@zmcre.com
While we strive to provide the most accurate information, all listing information, and demographic data, is provided by third-parties. As such, MyEListing will not be responsible for the accuracy of the information. It is strongly recommended that you verify all information with the listing agent, and any relevant agencies, prior to making any decisions.


