Industrial Properties
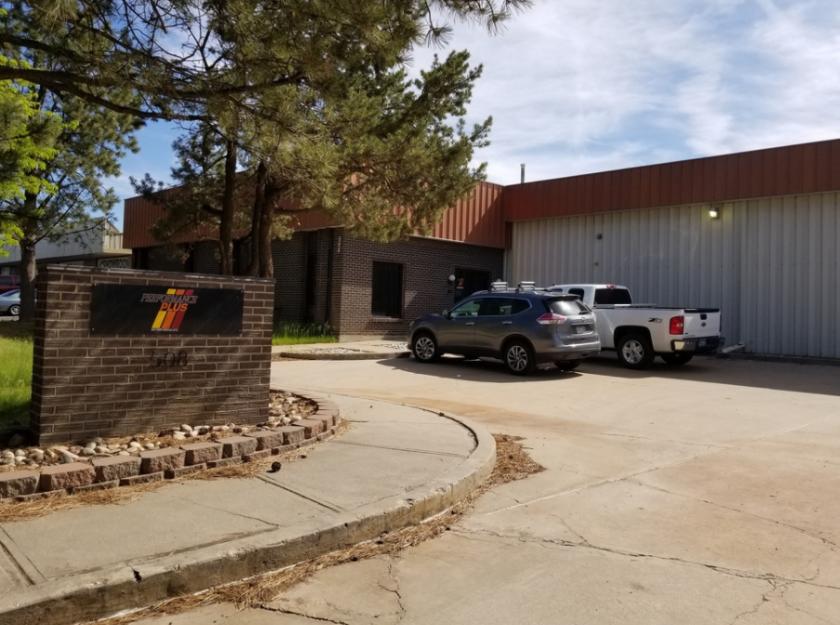
508 Olathe Street Aurora, CO 80011
508 Olathe Street Aurora, CO 80011
Details & Description
Property Highlights
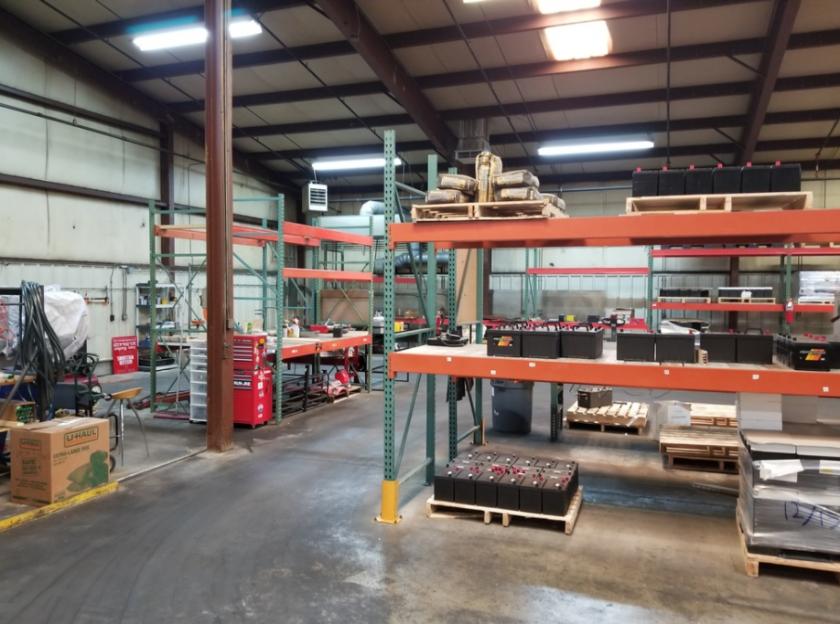
- • Well Maintained
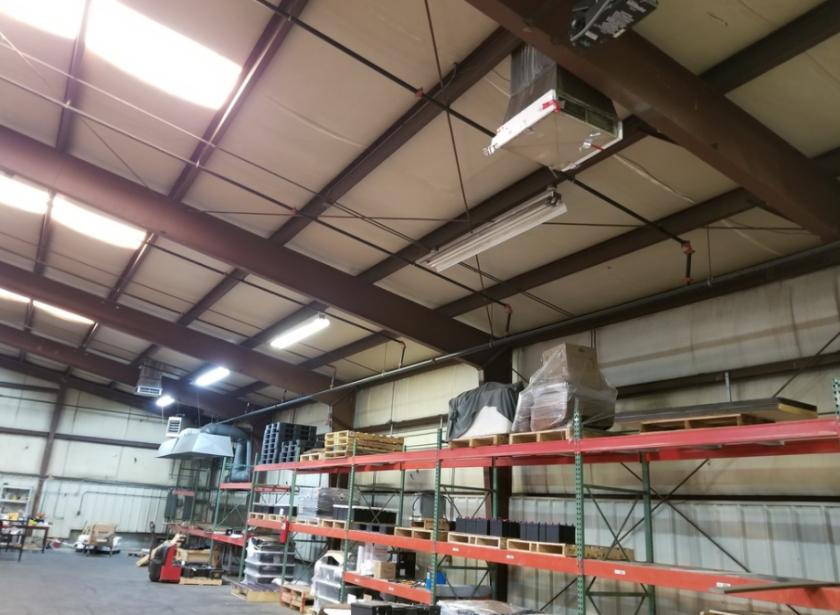
- • Insulated
- • Kitchenette
- • Partially Fenced Lot
- • 1,500 SF Office with HVAC
- • Metal Roof
Listing Agents

Charles Nusbaum
O: 303-454-5420
cnusbaum@antonoff.com
O: 303-454-5420
cnusbaum@antonoff.com
While we strive to provide the most accurate information, all listing information, and demographic data, is provided by third-parties. As such, MyEListing will not be responsible for the accuracy of the information. It is strongly recommended that you verify all information with the listing agent, and any relevant agencies, prior to making any decisions.