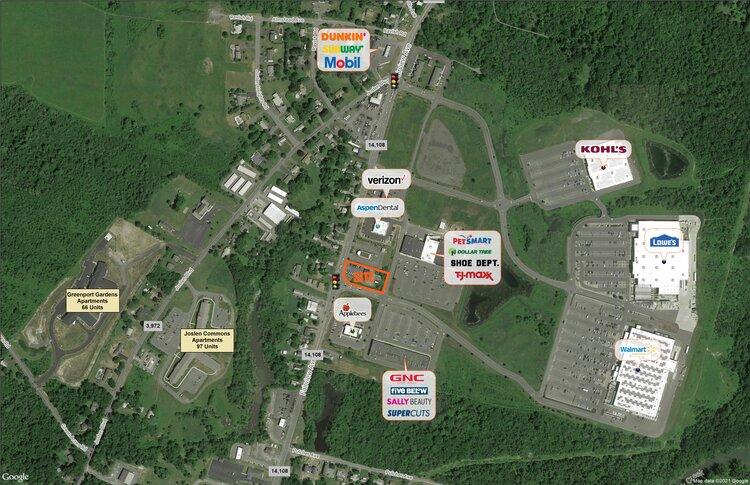
1-Mile | 3-Miles | 5-Miles | ||
---|---|---|---|---|
Total Population | 1,660 | 13,594 | 20,946 | |
Population Median Age | 44 | 42 | 43 | |
Population by Age | 0-9 Yrs | 151 (9%) | 1418 (10%) | 2211 (10%) |
10-19 Yrs | 194 (11%) | 1281 (9%) | 1923 (9%) | |
20-29 Yrs | 207 (12%) | 2026 (14%) | 2987 (14%) | |
30-39 Yrs | 137 (8%) | 1489 (10%) | 2237 (10%) | |
40-49 Yrs | 197 (11%) | 1686 (12%) | 2544 (12%) | |
50-59 Yrs | 322 (19%) | 2230 (16%) | 3340 (15%) | |
60-69 Yrs | 184 (11%) | 1775 (13%) | 2874 (13%) | |
70+ Yrs | 268 (16%) | 1687 (12%) | 2830 (13%) | |
Median HH Income | $54,178 | $51,080 | $54,366 | |
Total Household Income | < 24K | 181 (25%) | 1593 (27%) | 2212 (25%) |
25-49K | 150 (21%) | 1225 (21%) | 1833 (21%) | |
50-74K | 108 (15%) | 1004 (17%) | 1583 (18%) | |
75-99K | 112 (15%) | 735 (12%) | 1102 (12%) | |
100-199K | 134 (18%) | 959 (16%) | 1619 (18%) | |
200K+ | 24 (3%) | 222 (3%) | 329 (3%) | |
Highest Education Level | No Diploma | 151 | 1282 | 1925 |
Diploma or GED | 468 | 3454 | 5471 | |
Some College | 178 | 1561 | 2406 | |
Assoc. Degree | 106 | 914 | 1530 | |
Bachelors Degree | 168 | 1432 | 2153 | |
Higher Degree | 118 | 1143 | 1686 | |
Total Housing Units | 787 | 7,067 | 10,839 | |
--Owner-Occupied | 455 | 3,190 | 5,315 | |
--Renter-Occupied | 254 | 2,549 | 3,363 | |
Owner-Occupied Values | < 100K | 127 | 522 | 863 |
100-199K | 203 | 1317 | 2122 | |
200-299K | 95 | 758 | 1259 | |
300-399K | 8 | 221 | 439 | |
400-499K | 11 | 104 | 201 | |
500K+ | 11 | 267 | 430 | |
Total Working Age Population | 1,373 | 11,334 | 17,599 | |
In Work Force | 851 | 6,997 | 10,721 | |
Not In Work Force | 522 | 4,337 | 6,878 | |
Workforce Employed | 792 | 6,538 | 10,127 | |
Workforce Unemployed | 59 | 459 | 595 | |
Civlian Workforce | 851 | 6,997 | 10,721 | |
Military Workforce | 0 | 0 | 0 | |
Total Households | 709 | 5,739 | 8,678 | |
Family Households | 450 | 3,184 | 5,014 | |
Non-Family Households | 259 | 2,554 | 3,664 | |
Married Couple | 303 | 2,166 | 3,530 | |
Other Family | 147 | 1,018 | 1,484 | |
Married w/Child | 70 | 700 | 1,067 | |
Single Male w/Child | 5 | 101 | 140 | |
Single Female w/Child | 60 | 515 | 736 |
Population Change Last Two Decades - Plus Projection
2000 | % | 2010 | % | 2020 | % | 2030 | |
---|---|---|---|---|---|---|---|
New York | 18,976,457 | +2 | 19,378,102 | +4 | 20,146,131 | +2 | 20,604,030 |
Columbia County | 63,094 | 0 | 63,096 | -5 | 59,939 | -5 | 57,200 |
Greene County | 48,195 | +2 | 49,221 | -5 | 46,779 | -3 | 45,392 |
Total Working Age Population:
Total Households:
Total Working Age Population:
Total Households:
Total Working Age Population:
Total Households: