Retail Space
1020 West 41st Street Baltimore, MD 21211
1020 West 41st Street Baltimore, MD 21211
Details & Description
Property Highlights
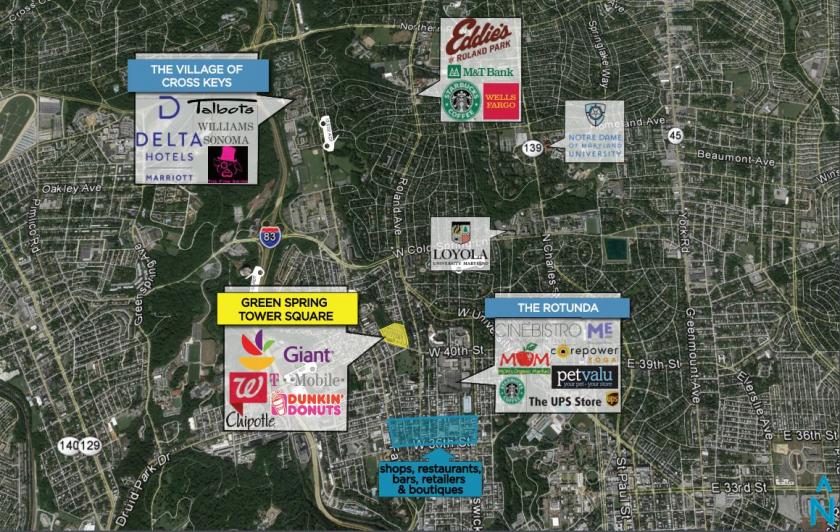
• Two college campuses located within minutes of the center Loyola University and Johns Hopkins University
• Located in the vibrant and charming Hampden section of Baltimore City, just off Falls Road
Listing Agents

Michael Stoltz
O: 410-308-0700
mstoltz@mfirealty.com
O: 410-308-0700
mstoltz@mfirealty.com
While we strive to provide the most accurate information, all listing information, and demographic data, is provided by third-parties. As such, MyEListing will not be responsible for the accuracy of the information. It is strongly recommended that you verify all information with the listing agent, and any relevant agencies, prior to making any decisions.