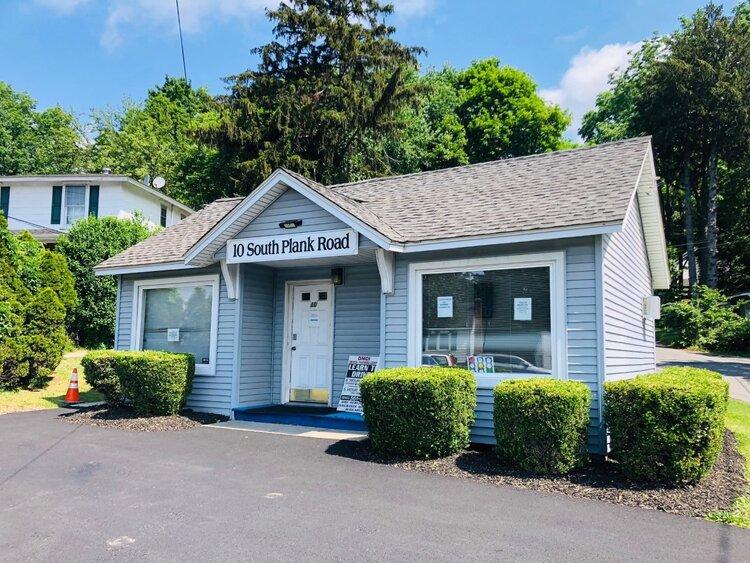
1-Mile | 3-Miles | 5-Miles | ||
---|---|---|---|---|
Total Population | 6,579 | 60,943 | 111,878 | |
Population Median Age | 38 | 37 | 38 | |
Population by Age | 0-9 Yrs | 914 (13%) | 8304 (13%) | 14055 (12%) |
10-19 Yrs | 791 (12%) | 8469 (13%) | 14219 (12%) | |
20-29 Yrs | 853 (12%) | 8572 (14%) | 15281 (13%) | |
30-39 Yrs | 982 (14%) | 8469 (13%) | 15487 (13%) | |
40-49 Yrs | 828 (12%) | 7368 (12%) | 14025 (12%) | |
50-59 Yrs | 857 (13%) | 7734 (12%) | 15213 (13%) | |
60-69 Yrs | 618 (9%) | 6483 (10%) | 12683 (11%) | |
70+ Yrs | 736 (11%) | 5543 (9%) | 10917 (9%) | |
Median HH Income | $64,163 | $56,839 | $68,601 | |
Total Household Income | < 24K | 420 (17%) | 5250 (23%) | 7510 (18%) |
25-49K | 513 (21%) | 5048 (22%) | 8629 (20%) | |
50-74K | 446 (18%) | 3492 (15%) | 6153 (14%) | |
75-99K | 381 (16%) | 2713 (12%) | 5406 (13%) | |
100-199K | 528 (22%) | 4805 (21%) | 10623 (25%) | |
200K+ | 81 (3%) | 994 (4%) | 3004 (7%) | |
Highest Education Level | No Diploma | 679 | 5926 | 8774 |
Diploma or GED | 1714 | 13078 | 22601 | |
Some College | 769 | 7448 | 14901 | |
Assoc. Degree | 417 | 3655 | 7646 | |
Bachelors Degree | 540 | 5480 | 12483 | |
Higher Degree | 359 | 4093 | 9575 | |
Total Housing Units | 2,673 | 26,050 | 47,174 | |
--Owner-Occupied | 1,441 | 11,506 | 24,004 | |
--Renter-Occupied | 929 | 10,797 | 17,321 | |
Owner-Occupied Values | < 100K | 130 | 1058 | 2023 |
100-199K | 703 | 3741 | 5580 | |
200-299K | 420 | 4194 | 8332 | |
300-399K | 134 | 1625 | 4870 | |
400-499K | 40 | 443 | 1943 | |
500K+ | 15 | 445 | 1255 | |
Total Working Age Population | 5,186 | 47,742 | 89,694 | |
In Work Force | 3,312 | 31,132 | 58,399 | |
Not In Work Force | 1,875 | 16,610 | 31,294 | |
Workforce Employed | 3,128 | 28,985 | 54,750 | |
Workforce Unemployed | 173 | 1,933 | 3,092 | |
Civlian Workforce | 3,301 | 30,917 | 57,842 | |
Military Workforce | 11 | 214 | 557 | |
Total Households | 2,370 | 22,303 | 41,325 | |
Family Households | 1,588 | 13,999 | 26,376 | |
Non-Family Households | 782 | 8,305 | 14,949 | |
Married Couple | 1,124 | 8,498 | 17,959 | |
Other Family | 463 | 5,501 | 8,417 | |
Married w/Child | 566 | 3,515 | 7,131 | |
Single Male w/Child | 47 | 615 | 913 | |
Single Female w/Child | 108 | 2,532 | 3,774 |
Population Change Last Two Decades - Plus Projection
2000 | % | 2010 | % | 2020 | % | 2030 | |
---|---|---|---|---|---|---|---|
New York | 18,976,457 | +2 | 19,378,102 | +4 | 20,146,131 | +2 | 20,604,030 |
Dutchess County | 280,150 | +6 | 297,488 | -2 | 292,936 | -1 | 290,338 |
Orange County | 341,367 | +9 | 372,813 | +3 | 384,125 | +4 | 397,598 |
Putnam County | 95,745 | +4 | 99,710 | 0 | 99,274 | +1 | 100,199 |
Ulster County | 177,749 | +3 | 182,493 | -2 | 179,009 | -1 | 176,893 |
Total Working Age Population:
Total Households:
Total Working Age Population:
Total Households:
Total Working Age Population:
Total Households: