Retail Space
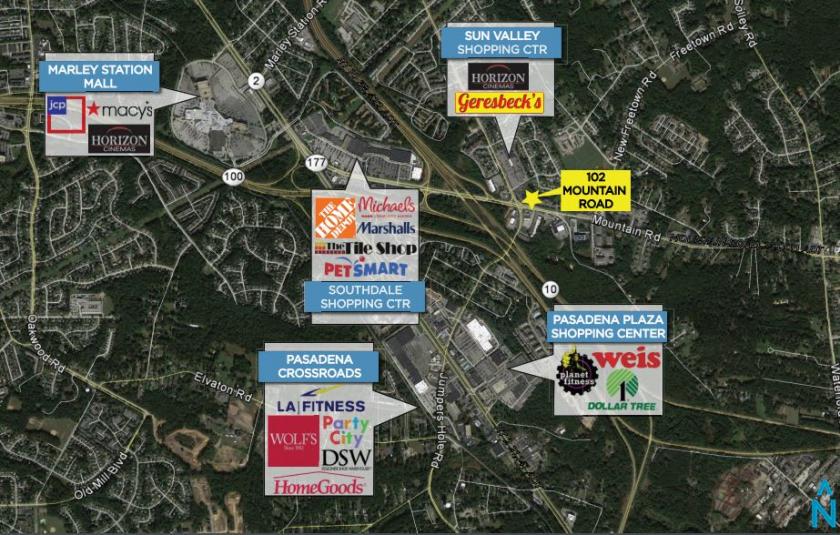
102 Mountain Road Glen Burnie, MD 21060
102 Mountain Road Glen Burnie, MD 21060
Details & Description
Property Highlights
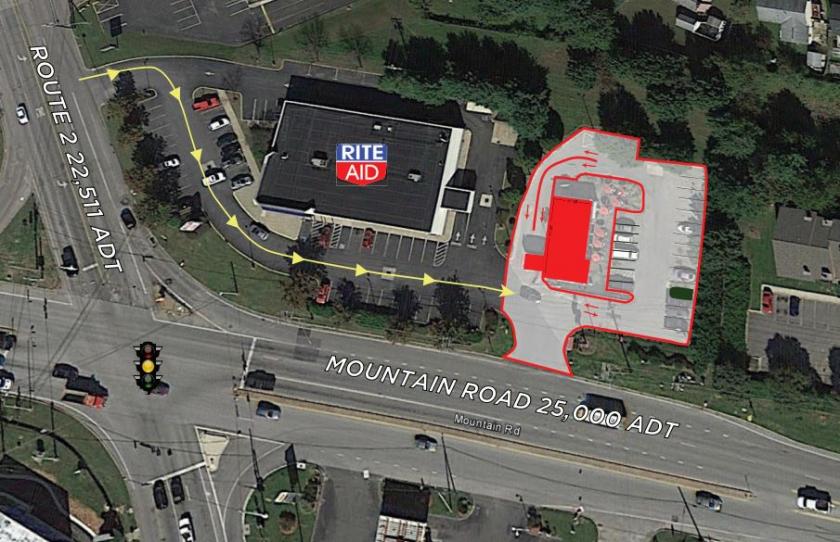
- • Currently has one drive-Thru lane
- • Easy access to Route 100 MD Route 2
- • Over 25,000 cars passing the site daily
Listing Agents

Michael Kociemba
O: 410-308-0700
mk@mfirealty.com
O: 410-308-0700
mk@mfirealty.com
While we strive to provide the most accurate information, all listing information, and demographic data, is provided by third-parties. As such, MyEListing will not be responsible for the accuracy of the information. It is strongly recommended that you verify all information with the listing agent, and any relevant agencies, prior to making any decisions.