Retail Space
2007 York Road LuthervilleTimonium, MD 21093
2007 York Road LuthervilleTimonium, MD 21093
Details & Description
Property Highlights
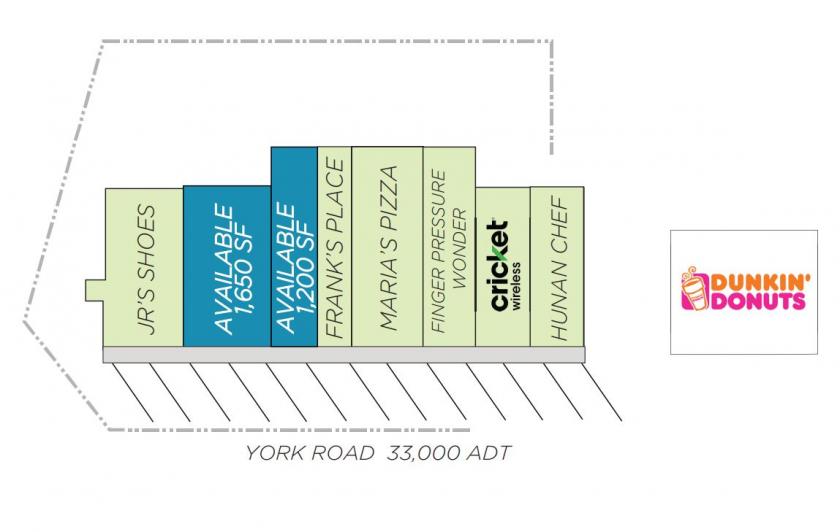
- • 1,200 SF 1,650 SF available
- • Parking directly in front of site
- • Easy access to I-83 I-695
Listing Agents

Jeff Banks
O: 301-814-1297
jbanks@mfirealty.com
O: 301-814-1297
jbanks@mfirealty.com
While we strive to provide the most accurate information, all listing information, and demographic data, is provided by third-parties. As such, MyEListing will not be responsible for the accuracy of the information. It is strongly recommended that you verify all information with the listing agent, and any relevant agencies, prior to making any decisions.