Retail Space
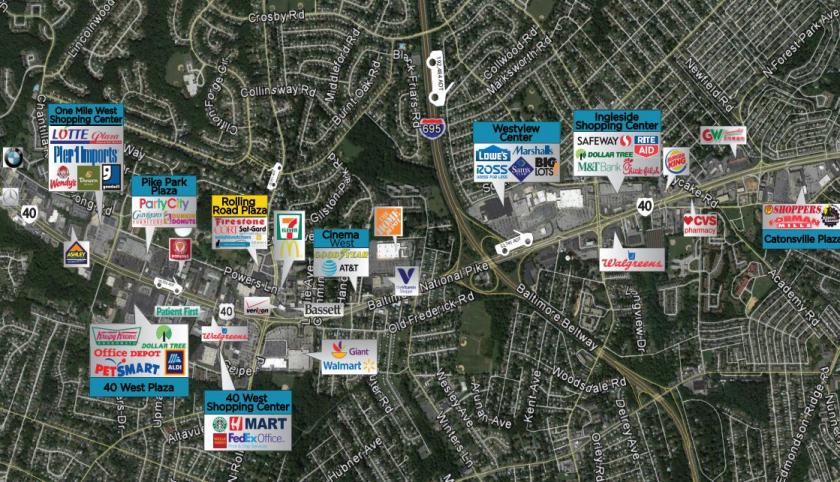
1110 North Rolling Road Catonsville, MD 21228
1110 North Rolling Road Catonsville, MD 21228
Details & Description
Property Highlights
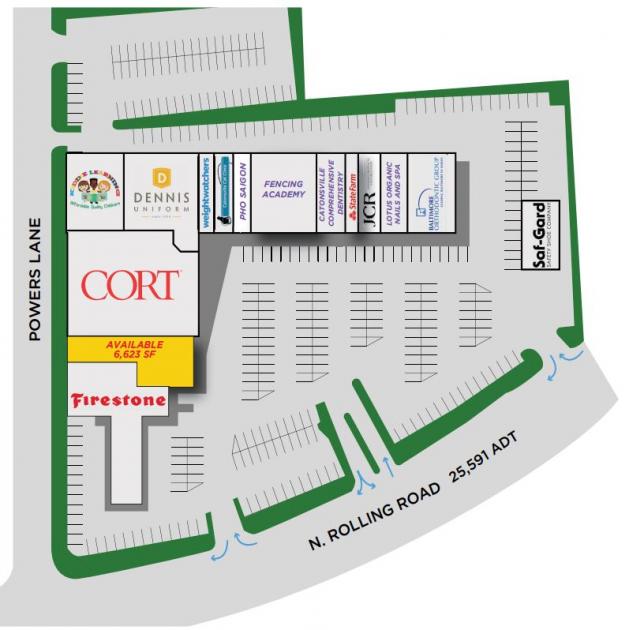
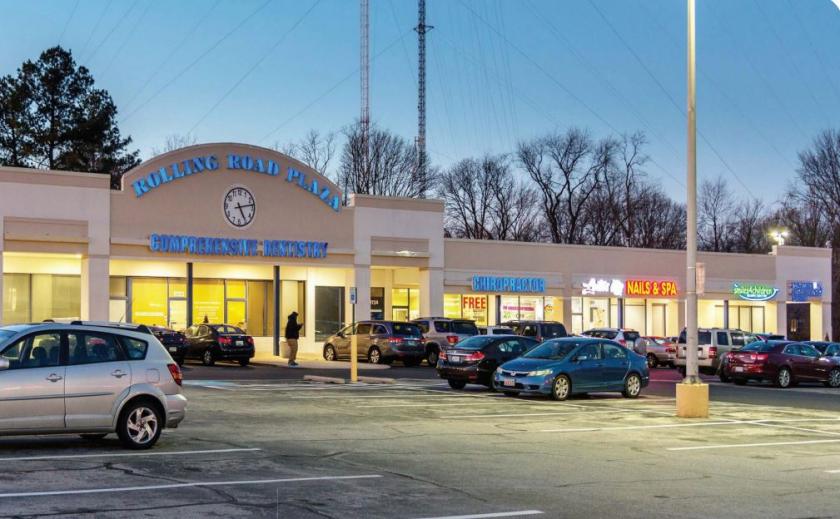
- • Inline space available
- • Zoned BL
- • Over 25,000 cars passing the site daily
Listing Agents

Jeff Banks
O: 301-814-1297
jbanks@mfirealty.com
O: 301-814-1297
jbanks@mfirealty.com
While we strive to provide the most accurate information, all listing information, and demographic data, is provided by third-parties. As such, MyEListing will not be responsible for the accuracy of the information. It is strongly recommended that you verify all information with the listing agent, and any relevant agencies, prior to making any decisions.