Retail Space
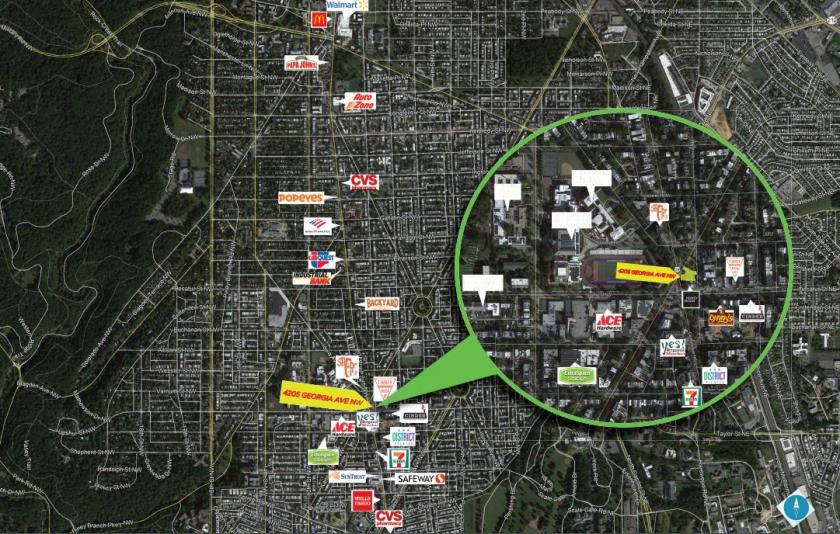
4205 Georgia Avenue Northwest Washington, DC 20011
4205 Georgia Avenue Northwest Washington, DC 20011
Details & Description
Property Highlights
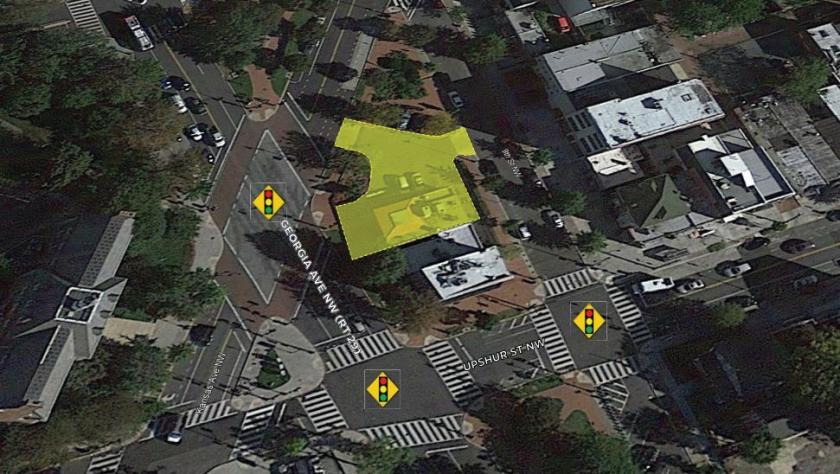
- • 3,889 SF lot, Zoned NC7
- • Excellent visibility and access from RT 29
- • Over 29,000 cars passing the site daily
Listing Agents

Evan Albert
O: 410-308-0700
evan@mfirealty.com
O: 410-308-0700
evan@mfirealty.com
While we strive to provide the most accurate information, all listing information, and demographic data, is provided by third-parties. As such, MyEListing will not be responsible for the accuracy of the information. It is strongly recommended that you verify all information with the listing agent, and any relevant agencies, prior to making any decisions.