Retail Space
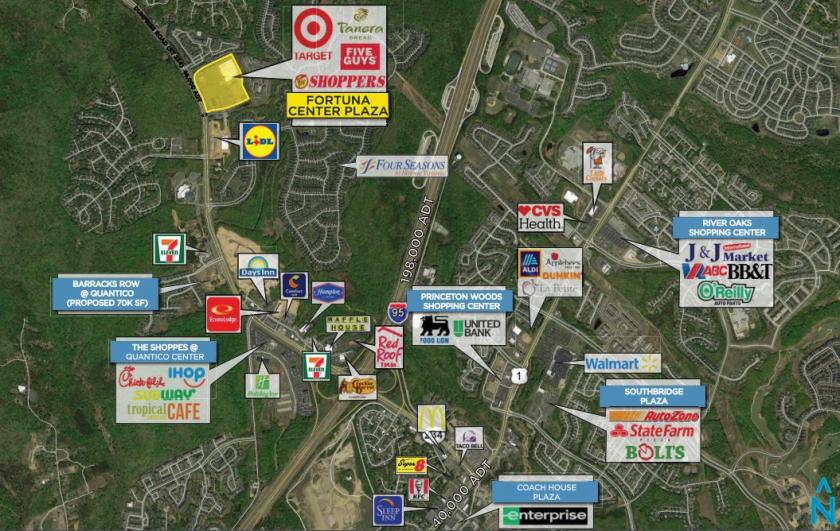
4100 Fortuna Center Plaza Montclair, VA 22025
4100 Fortuna Center Plaza Montclair, VA 22025
Details & Description
Property Highlights
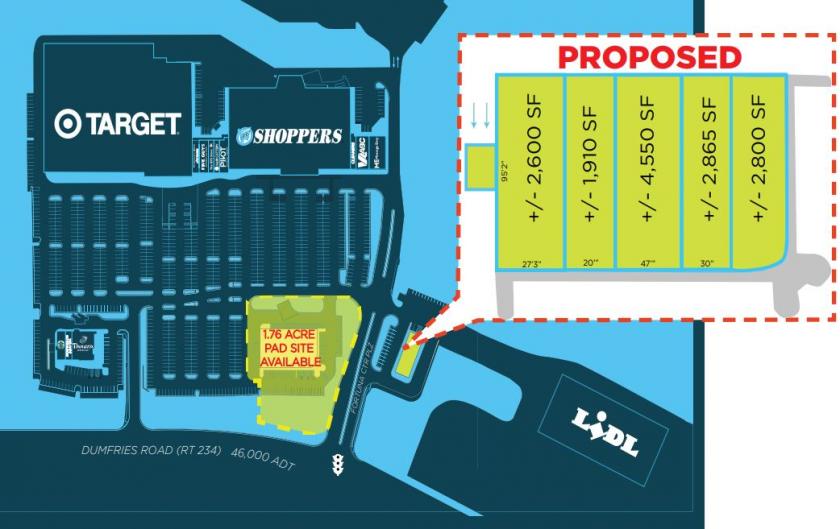
• Unparalleled visibility and access from Route 234 Dumfries Rd
• 1.76 acre, former Rite Aid, pad site available for lease
Listing Agents

Evan Albert
O: 410-308-0700
evan@mfirealty.com
O: 410-308-0700
evan@mfirealty.com
While we strive to provide the most accurate information, all listing information, and demographic data, is provided by third-parties. As such, MyEListing will not be responsible for the accuracy of the information. It is strongly recommended that you verify all information with the listing agent, and any relevant agencies, prior to making any decisions.