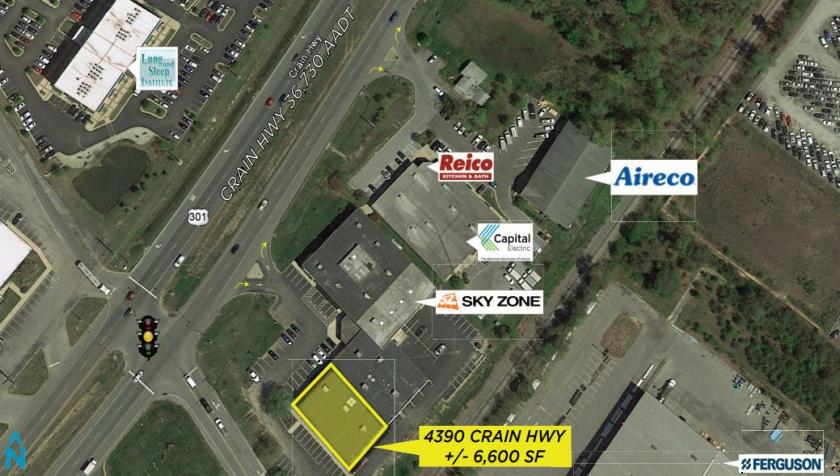
1-Mile | 3-Miles | 5-Miles | ||
---|---|---|---|---|
Total Population | 3,887 | 46,956 | 90,542 | |
Population Median Age | 39 | 36 | 36 | |
Population by Age | 0-9 Yrs | 505 (12%) | 6538 (13%) | 12144 (13%) |
10-19 Yrs | 413 (10%) | 6567 (13%) | 12908 (14%) | |
20-29 Yrs | 542 (13%) | 6647 (14%) | 12212 (13%) | |
30-39 Yrs | 568 (14%) | 6993 (14%) | 12818 (14%) | |
40-49 Yrs | 469 (12%) | 6723 (14%) | 12996 (14%) | |
50-59 Yrs | 468 (12%) | 6271 (13%) | 13206 (14%) | |
60-69 Yrs | 469 (12%) | 4613 (9%) | 8767 (9%) | |
70+ Yrs | 452 (11%) | 2602 (5%) | 5493 (6%) | |
Median HH Income | $96,827 | $92,576 | $97,403 | |
Total Household Income | < 24K | 113 (8%) | 1594 (8%) | 3032 (9%) |
25-49K | 129 (9%) | 2455 (13%) | 4036 (12%) | |
50-74K | 230 (17%) | 2809 (15%) | 4961 (15%) | |
75-99K | 228 (16%) | 2844 (16%) | 4984 (15%) | |
100-199K | 554 (41%) | 6326 (35%) | 12260 (37%) | |
200K+ | 89 (6%) | 1688 (9%) | 3718 (11%) | |
Highest Education Level | No Diploma | 275 | 1810 | 3738 |
Diploma or GED | 927 | 8714 | 17065 | |
Some College | 738 | 8251 | 15041 | |
Assoc. Degree | 245 | 2830 | 5455 | |
Bachelors Degree | 331 | 5238 | 10717 | |
Higher Degree | 213 | 3941 | 7668 | |
Total Housing Units | 1,393 | 18,590 | 34,673 | |
--Owner-Occupied | 903 | 11,578 | 23,269 | |
--Renter-Occupied | 442 | 6,137 | 9,723 | |
Owner-Occupied Values | < 100K | 37 | 306 | 635 |
100-199K | 176 | 2116 | 3275 | |
200-299K | 442 | 4498 | 7855 | |
300-399K | 190 | 3157 | 7389 | |
400-499K | 50 | 1182 | 3085 | |
500K+ | 8 | 319 | 1029 | |
Total Working Age Population | 3,088 | 36,448 | 70,553 | |
In Work Force | 1,970 | 26,279 | 49,946 | |
Not In Work Force | 1,118 | 10,170 | 20,606 | |
Workforce Employed | 1,858 | 24,628 | 47,062 | |
Workforce Unemployed | 80 | 1,017 | 1,866 | |
Civlian Workforce | 1,938 | 25,645 | 48,928 | |
Military Workforce | 31 | 634 | 1,018 | |
Total Households | 1,345 | 17,715 | 32,992 | |
Family Households | 888 | 11,993 | 23,449 | |
Non-Family Households | 457 | 5,722 | 9,543 | |
Married Couple | 514 | 7,234 | 15,165 | |
Other Family | 375 | 4,759 | 8,284 | |
Married w/Child | 198 | 3,247 | 6,839 | |
Single Male w/Child | 26 | 407 | 674 | |
Single Female w/Child | 87 | 2,339 | 3,784 |
Population Change Last Two Decades - Plus Projection
2000 | % | 2010 | % | 2020 | % | 2030 | |
---|---|---|---|---|---|---|---|
Maryland | 5,296,486 | +9 | 5,773,552 | +6 | 6,141,900 | +6 | 6,518,750 |
Charles County | 120,546 | +22 | 146,551 | +14 | 167,050 | +17 | 194,650 |
Prince Georges County | 801,515 | +8 | 863,420 | +6 | 916,150 | +4 | 952,950 |
Total Working Age Population:
Total Households:
Total Working Age Population:
Total Households:
Total Working Age Population:
Total Households: