Retail Space
3620 West Pioneer Drive Irving, TX 75061
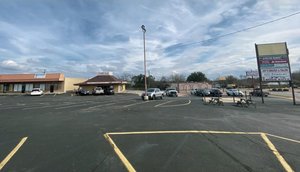
3620 West Pioneer Drive Irving, TX 75061

Details & Description
Property Highlights
- • Great Location
- • High Traffic Area
- • Below Market Rent
- • Minutes from TX-183
- • Excellent Tenant Mix
- • Value Add Opportunity
Listing Agents

Daniel Eng
O: 469-916-8888
M: 214-926-3666
daniel@engvest.com
O: 469-916-8888
M: 214-926-3666
daniel@engvest.com

Calvin Wong
O: 469-916-8888
M: 972-904-2888
calvin@engvest.com
O: 469-916-8888
M: 972-904-2888
calvin@engvest.com

Judy Ratsamy
O: 469-916-8888
M: 817-915-5075
judy@engvest.com
O: 469-916-8888
M: 817-915-5075
judy@engvest.com
While we strive to provide the most accurate information, all listing information, and demographic data, is provided by third-parties. As such, MyEListing will not be responsible for the accuracy of the information. It is strongly recommended that you verify all information with the listing agent, and any relevant agencies, prior to making any decisions.