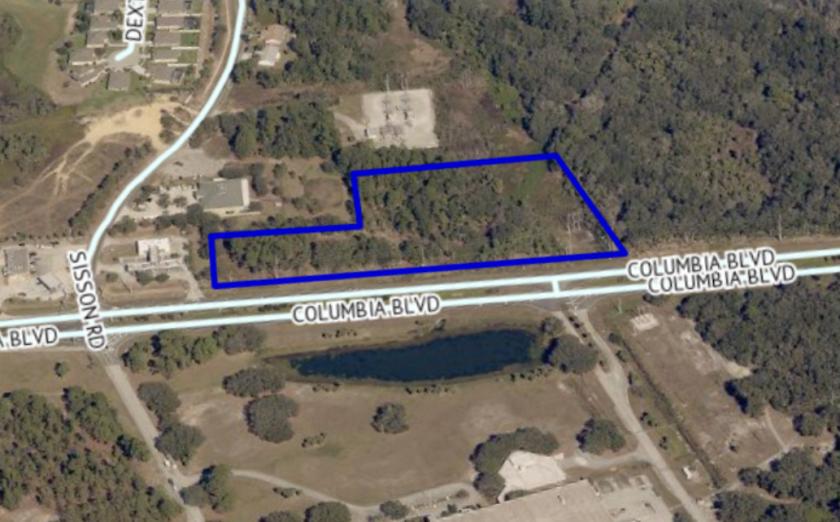
1-Mile | 3-Miles | 5-Miles | ||
---|---|---|---|---|
Total Population | 2,873 | 25,466 | 65,230 | |
Population Median Age | 43 | 44 | 44 | |
Population by Age | 0-9 Yrs | 319 (11%) | 3167 (12%) | 7030 (10%) |
10-19 Yrs | 305 (10%) | 2079 (8%) | 6179 (9%) | |
20-29 Yrs | 199 (6%) | 2737 (10%) | 6966 (10%) | |
30-39 Yrs | 362 (12%) | 3181 (12%) | 8533 (13%) | |
40-49 Yrs | 402 (13%) | 2304 (9%) | 6582 (10%) | |
50-59 Yrs | 482 (16%) | 3952 (15%) | 10295 (15%) | |
60-69 Yrs | 427 (14%) | 3979 (15%) | 9981 (15%) | |
70+ Yrs | 377 (13%) | 4066 (15%) | 9663 (14%) | |
Median HH Income | $65,818 | $55,435 | $53,791 | |
Total Household Income | < 24K | 215 (17%) | 1939 (18%) | 4841 (18%) |
25-49K | 271 (22%) | 2754 (26%) | 7439 (28%) | |
50-74K | 183 (15%) | 2468 (23%) | 6009 (22%) | |
75-99K | 167 (13%) | 1245 (11%) | 2810 (10%) | |
100-199K | 302 (24%) | 1707 (16%) | 4605 (17%) | |
200K+ | 72 (5%) | 289 (2%) | 752 (2%) | |
Highest Education Level | No Diploma | 74 | 1260 | 3838 |
Diploma or GED | 460 | 6023 | 15517 | |
Some College | 395 | 4073 | 11165 | |
Assoc. Degree | 453 | 2800 | 6330 | |
Bachelors Degree | 491 | 3202 | 7875 | |
Higher Degree | 280 | 1823 | 4272 | |
Total Housing Units | 1,500 | 13,010 | 34,591 | |
--Owner-Occupied | 908 | 7,423 | 18,993 | |
--Renter-Occupied | 302 | 2,979 | 7,463 | |
Owner-Occupied Values | < 100K | 156 | 1956 | 4670 |
100-199K | 346 | 2629 | 7739 | |
200-299K | 265 | 1809 | 4112 | |
300-399K | 107 | 702 | 1423 | |
400-499K | 18 | 140 | 377 | |
500K+ | 16 | 187 | 671 | |
Total Working Age Population | 2,393 | 21,109 | 54,460 | |
In Work Force | 1,462 | 11,433 | 30,588 | |
Not In Work Force | 931 | 9,676 | 23,872 | |
Workforce Employed | 1,344 | 10,726 | 28,601 | |
Workforce Unemployed | 117 | 703 | 1,964 | |
Civlian Workforce | 1,462 | 11,429 | 30,564 | |
Military Workforce | 0 | 3 | 24 | |
Total Households | 1,210 | 10,402 | 26,456 | |
Family Households | 757 | 6,273 | 16,177 | |
Non-Family Households | 453 | 4,129 | 10,279 | |
Married Couple | 617 | 4,931 | 12,525 | |
Other Family | 139 | 1,342 | 3,652 | |
Married w/Child | 219 | 1,451 | 3,494 | |
Single Male w/Child | 2 | 269 | 521 | |
Single Female w/Child | 19 | 285 | 1,094 |
Population Change Last Two Decades - Plus Projection
2000 | % | 2010 | % | 2020 | % | 2030 | |
---|---|---|---|---|---|---|---|
Florida | 15,982,378 | +18 | 18,801,310 | +14 | 21,517,610 | +13 | 24,340,457 |
Brevard County | 476,230 | +14 | 543,376 | +10 | 598,486 | +10 | 656,288 |
Orange County | 896,344 | +28 | 1,145,956 | +24 | 1,415,511 | +20 | 1,693,977 |
Total Working Age Population:
Total Households:
Total Working Age Population:
Total Households:
Total Working Age Population:
Total Households: