Specialty Real Estate
4833 Church Street Zachary, LA 70791
4833 Church Street Zachary, LA 70791
Details & Description
Property Highlights
• The property is surrounded by local retail amenities such as Bank of Zachary, Winn Dixie, OReillys, Taco Bell
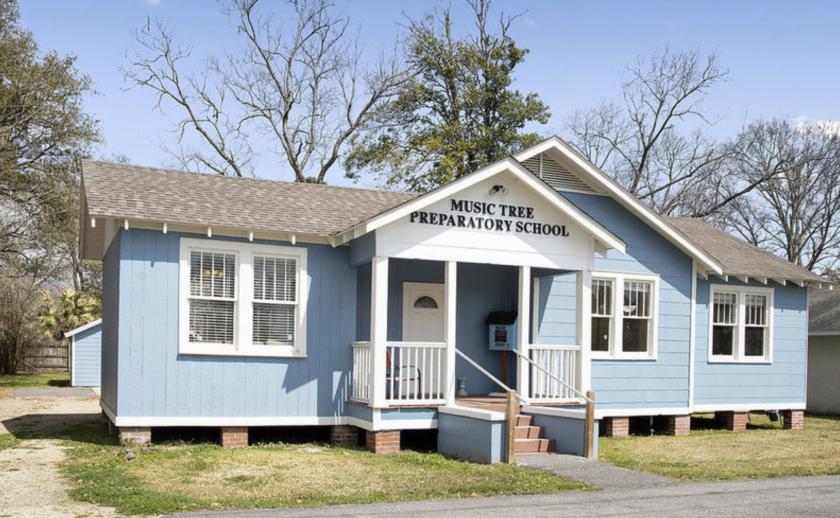
• Site was home to The Music Tree Music Preparatory School Moved to 100 online operations through May
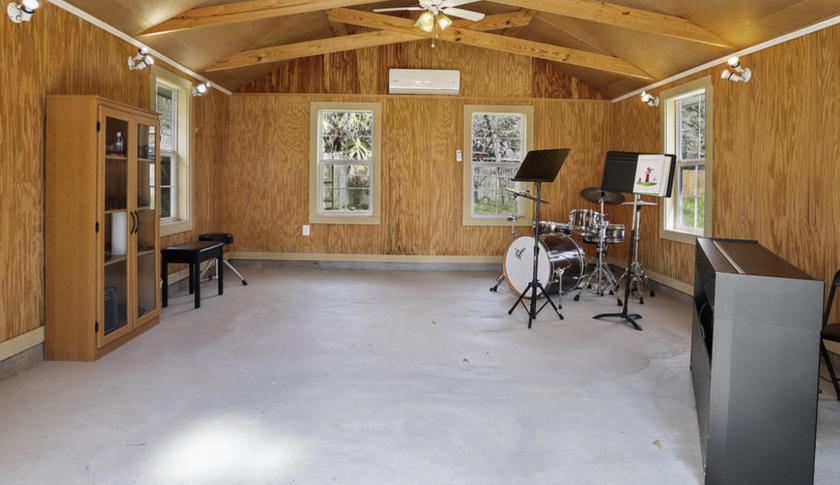
Additional Photos


Listing Agents

Mike Gennaro
EXP Commercial
O: 225-931-3111
mike.gennaro@expcommercial.com
EXP Commercial
O: 225-931-3111
mike.gennaro@expcommercial.com
While we strive to provide the most accurate information, all listing information, and demographic data, is provided by third-parties. As such, MyEListing will not be responsible for the accuracy of the information. It is strongly recommended that you verify all information with the listing agent, and any relevant agencies, prior to making any decisions.


