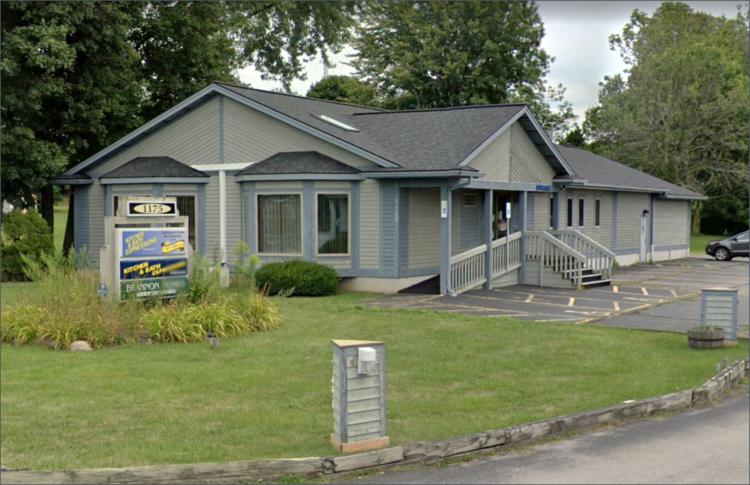
1-Mile | 3-Miles | 5-Miles | ||
---|---|---|---|---|
Total Population | 8,771 | 36,463 | 75,916 | |
Population Median Age | 42 | 42 | 43 | |
Population by Age | 0-9 Yrs | 959 (10%) | 4141 (11%) | 8475 (11%) |
10-19 Yrs | 876 (9%) | 4325 (11%) | 8826 (11%) | |
20-29 Yrs | 1260 (14%) | 3631 (9%) | 7300 (9%) | |
30-39 Yrs | 1070 (12%) | 4234 (11%) | 8714 (11%) | |
40-49 Yrs | 1064 (12%) | 4832 (13%) | 9180 (12%) | |
50-59 Yrs | 957 (10%) | 5381 (14%) | 12062 (15%) | |
60-69 Yrs | 1088 (12%) | 4727 (12%) | 10379 (13%) | |
70+ Yrs | 1497 (17%) | 5191 (14%) | 10980 (14%) | |
Median HH Income | $55,117 | $80,591 | $85,043 | |
Total Household Income | < 24K | 710 (17%) | 1945 (12%) | 3335 (10%) |
25-49K | 1187 (28%) | 2739 (18%) | 5364 (17%) | |
50-74K | 814 (19%) | 2422 (16%) | 5065 (16%) | |
75-99K | 358 (8%) | 1981 (13%) | 4523 (14%) | |
100-199K | 935 (22%) | 4755 (31%) | 9862 (31%) | |
200K+ | 126 (3%) | 1256 (8%) | 3013 (9%) | |
Highest Education Level | No Diploma | 311 | 1259 | 2488 |
Diploma or GED | 1430 | 5223 | 10809 | |
Some College | 1316 | 4390 | 8811 | |
Assoc. Degree | 978 | 3484 | 6770 | |
Bachelors Degree | 1289 | 6321 | 14358 | |
Higher Degree | 1182 | 5734 | 12267 | |
Total Housing Units | 4,359 | 15,637 | 32,540 | |
--Owner-Occupied | 2,069 | 11,042 | 24,770 | |
--Renter-Occupied | 2,060 | 4,057 | 6,392 | |
Owner-Occupied Values | < 100K | 208 | 556 | 1297 |
100-199K | 1275 | 5263 | 11950 | |
200-299K | 449 | 3538 | 7351 | |
300-399K | 97 | 1116 | 2750 | |
400-499K | 16 | 317 | 772 | |
500K+ | 23 | 253 | 650 | |
Total Working Age Population | 7,229 | 29,423 | 61,614 | |
In Work Force | 4,554 | 19,551 | 41,229 | |
Not In Work Force | 2,675 | 9,872 | 20,385 | |
Workforce Employed | 4,487 | 19,170 | 40,361 | |
Workforce Unemployed | 66 | 381 | 868 | |
Civlian Workforce | 4,554 | 19,551 | 41,229 | |
Military Workforce | 0 | 0 | 0 | |
Total Households | 4,129 | 15,099 | 31,162 | |
Family Households | 2,225 | 10,196 | 21,489 | |
Non-Family Households | 1,905 | 4,903 | 9,673 | |
Married Couple | 1,597 | 8,426 | 18,118 | |
Other Family | 628 | 1,771 | 3,370 | |
Married w/Child | 605 | 3,416 | 7,011 | |
Single Male w/Child | 53 | 199 | 471 | |
Single Female w/Child | 286 | 636 | 1,073 |
Population Change Last Two Decades - Plus Projection
2000 | % | 2010 | % | 2020 | % | 2030 | |
---|---|---|---|---|---|---|---|
New York | 18,976,457 | +2 | 19,378,102 | +4 | 20,146,131 | +2 | 20,604,030 |
Monroe County | 735,343 | +1 | 744,344 | +1 | 754,529 | +1 | 758,536 |
Wayne County | 93,765 | 0 | 93,772 | -4 | 89,564 | -3 | 86,754 |
Total Working Age Population:
Total Households:
Total Working Age Population:
Total Households:
Total Working Age Population:
Total Households: