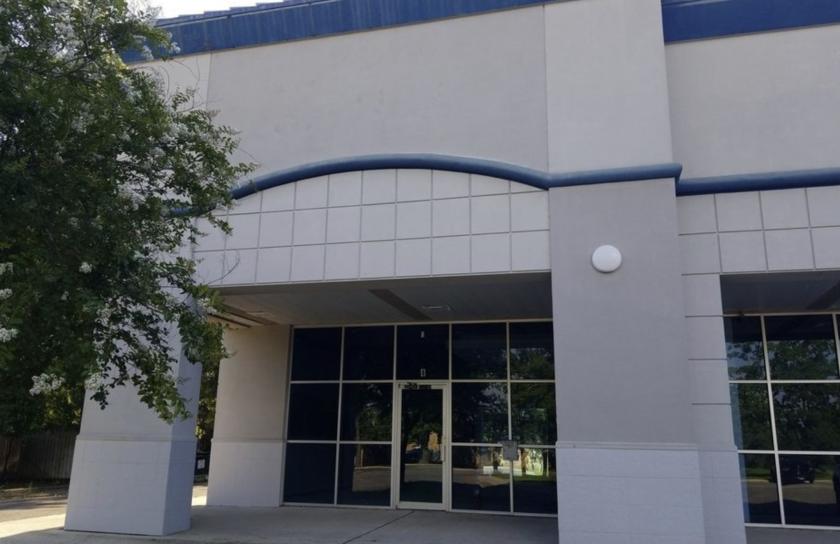
1-Mile | 3-Miles | 5-Miles | ||
---|---|---|---|---|
Total Population | 1,066 | 14,757 | 33,159 | |
Population Median Age | 35 | 36 | 36 | |
Population by Age | 0-9 Yrs | 181 (16%) | 2178 (14%) | 4693 (14%) |
10-19 Yrs | 173 (16%) | 2458 (16%) | 5148 (15%) | |
20-29 Yrs | 182 (17%) | 1877 (12%) | 4600 (13%) | |
30-39 Yrs | 114 (10%) | 2020 (13%) | 4303 (12%) | |
40-49 Yrs | 93 (8%) | 1863 (12%) | 4193 (12%) | |
50-59 Yrs | 107 (10%) | 1791 (12%) | 4302 (12%) | |
60-69 Yrs | 102 (9%) | 1309 (8%) | 3433 (10%) | |
70+ Yrs | 114 (10%) | 1261 (8%) | 2487 (7%) | |
Median HH Income | $35,881 | $79,373 | $67,170 | |
Total Household Income | < 24K | 134 (34%) | 858 (17%) | 1918 (16%) |
25-49K | 101 (25%) | 821 (16%) | 2319 (20%) | |
50-74K | 44 (11%) | 678 (13%) | 1910 (16%) | |
75-99K | 41 (10%) | 752 (15%) | 1749 (15%) | |
100-199K | 66 (16%) | 1415 (28%) | 2517 (22%) | |
200K+ | 7 (1%) | 453 (9%) | 880 (7%) | |
Highest Education Level | No Diploma | 58 | 569 | 1570 |
Diploma or GED | 186 | 2536 | 6559 | |
Some College | 177 | 1948 | 4974 | |
Assoc. Degree | 52 | 774 | 1867 | |
Bachelors Degree | 102 | 2004 | 3781 | |
Higher Degree | 42 | 1148 | 2190 | |
Total Housing Units | 451 | 5,420 | 12,784 | |
--Owner-Occupied | 226 | 3,920 | 8,531 | |
--Renter-Occupied | 167 | 1,056 | 2,763 | |
Owner-Occupied Values | < 100K | 74 | 622 | 1724 |
100-199K | 88 | 1164 | 3229 | |
200-299K | 50 | 1243 | 1975 | |
300-399K | 12 | 444 | 747 | |
400-499K | 2 | 227 | 423 | |
500K+ | 2 | 220 | 432 | |
Total Working Age Population | 768 | 11,001 | 25,360 | |
In Work Force | 438 | 7,264 | 17,079 | |
Not In Work Force | 330 | 3,737 | 8,281 | |
Workforce Employed | 414 | 6,921 | 16,120 | |
Workforce Unemployed | 24 | 342 | 872 | |
Civlian Workforce | 438 | 7,264 | 16,992 | |
Military Workforce | 0 | 0 | 87 | |
Total Households | 393 | 4,976 | 11,294 | |
Family Households | 216 | 3,549 | 8,024 | |
Non-Family Households | 177 | 1,427 | 3,270 | |
Married Couple | 111 | 2,750 | 5,501 | |
Other Family | 104 | 799 | 2,523 | |
Married w/Child | 66 | 1,499 | 2,471 | |
Single Male w/Child | 12 | 70 | 201 | |
Single Female w/Child | 58 | 349 | 1,143 |
Population Change Last Two Decades - Plus Projection
2000 | % | 2010 | % | 2020 | % | 2030 | |
---|---|---|---|---|---|---|---|
Louisiana | 4,468,976 | +1 | 4,533,372 | +1 | 4,588,310 | +5 | 4,813,420 |
East Baton Rouge Parish | 412,852 | +7 | 440,171 | -3 | 426,380 | -1 | 421,500 |
East Feliciana Parish | 21,360 | -5 | 20,267 | -8 | 18,610 | -8 | 17,060 |
West Baton Rouge Parish | 21,601 | +10 | 23,788 | -7 | 22,220 | -5 | 21,070 |
West Feliciana Parish | 15,111 | +3 | 15,625 | -3 | 15,120 | -6 | 14,260 |
Total Working Age Population:
Total Households:
Total Working Age Population:
Total Households:
Total Working Age Population:
Total Households: