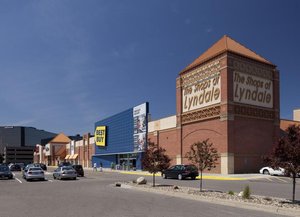
1-Mile | 3-Miles | 5-Miles | ||
---|---|---|---|---|
Total Population | 7,438 | 78,311 | 217,641 | |
Population Median Age | 40 | 39 | 39 | |
Population by Age | 0-9 Yrs | 990 (13%) | 10526 (13%) | 28125 (12%) |
10-19 Yrs | 906 (12%) | 9470 (12%) | 24096 (11%) | |
20-29 Yrs | 943 (12%) | 11011 (14%) | 29660 (13%) | |
30-39 Yrs | 970 (13%) | 11101 (14%) | 31956 (14%) | |
40-49 Yrs | 876 (11%) | 8262 (10%) | 24436 (11%) | |
50-59 Yrs | 769 (10%) | 8973 (11%) | 27821 (12%) | |
60-69 Yrs | 981 (13%) | 9013 (11%) | 26053 (11%) | |
70+ Yrs | 1004 (13%) | 9955 (12%) | 25493 (11%) | |
Median HH Income | $68,581 | $70,957 | $72,580 | |
Total Household Income | < 24K | 406 (13%) | 4001 (13%) | 11668 (13%) |
25-49K | 714 (24%) | 6504 (21%) | 17574 (20%) | |
50-74K | 467 (15%) | 5177 (17%) | 15457 (17%) | |
75-99K | 355 (12%) | 4195 (14%) | 12799 (14%) | |
100-199K | 758 (25%) | 7897 (26%) | 22897 (26%) | |
200K+ | 251 (8%) | 2013 (6%) | 6084 (7%) | |
Highest Education Level | No Diploma | 255 | 3406 | 9789 |
Diploma or GED | 1091 | 12119 | 33216 | |
Some College | 815 | 9930 | 29343 | |
Assoc. Degree | 472 | 4531 | 14575 | |
Bachelors Degree | 1446 | 14803 | 41372 | |
Higher Degree | 1059 | 8402 | 24408 | |
Total Housing Units | 3,049 | 30,726 | 89,645 | |
--Owner-Occupied | 1,884 | 19,490 | 59,758 | |
--Renter-Occupied | 1,066 | 10,297 | 26,722 | |
Owner-Occupied Values | < 100K | 69 | 1678 | 4939 |
100-199K | 440 | 5368 | 16631 | |
200-299K | 637 | 7011 | 21871 | |
300-399K | 343 | 3131 | 9234 | |
400-499K | 178 | 1211 | 3646 | |
500K+ | 218 | 1092 | 3436 | |
Total Working Age Population | 5,869 | 62,728 | 175,100 | |
In Work Force | 3,845 | 42,278 | 120,825 | |
Not In Work Force | 2,024 | 20,450 | 54,275 | |
Workforce Employed | 3,722 | 40,257 | 115,941 | |
Workforce Unemployed | 123 | 2,001 | 4,852 | |
Civlian Workforce | 3,844 | 42,257 | 120,793 | |
Military Workforce | 0 | 21 | 32 | |
Total Households | 2,950 | 29,787 | 86,479 | |
Family Households | 1,860 | 19,017 | 52,978 | |
Non-Family Households | 1,090 | 10,770 | 33,501 | |
Married Couple | 1,312 | 14,374 | 40,340 | |
Other Family | 548 | 4,643 | 12,639 | |
Married w/Child | 591 | 5,640 | 15,612 | |
Single Male w/Child | 36 | 628 | 1,789 | |
Single Female w/Child | 301 | 1,933 | 4,959 |
Population Change Last Two Decades - Plus Projection
2000 | % | 2010 | % | 2020 | % | 2030 | |
---|---|---|---|---|---|---|---|
Minnesota | 4,919,479 | +8 | 5,303,925 | +7 | 5,687,161 | +5 | 5,974,304 |
Anoka County | 298,084 | +11 | 330,844 | +8 | 358,469 | +6 | 380,651 |
Hennepin County | 1,116,200 | +3 | 1,152,425 | +12 | 1,294,371 | +9 | 1,407,332 |
Ramsey County | 511,035 | 0 | 508,640 | +12 | 567,959 | +9 | 616,408 |
Total Working Age Population:
Total Households:
Total Working Age Population:
Total Households:
Total Working Age Population:
Total Households: