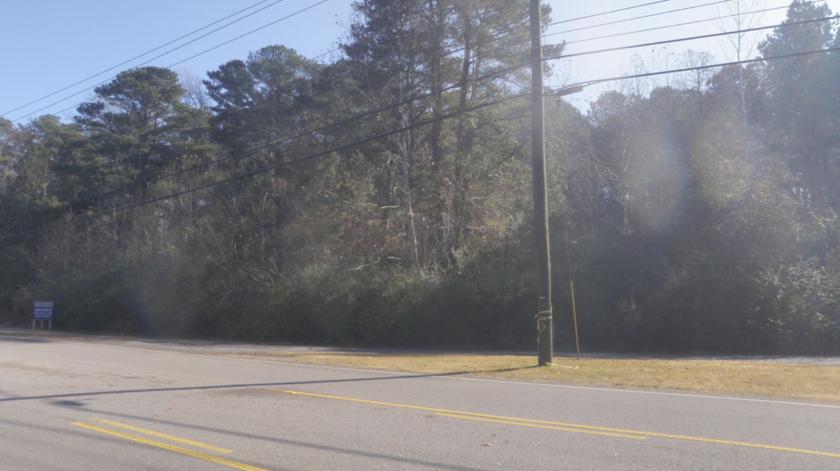
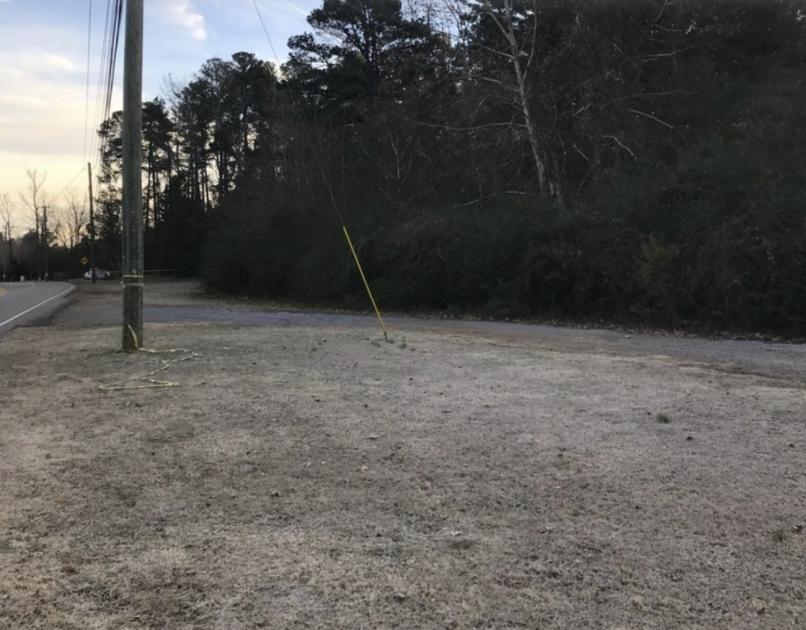
1-Mile | 3-Miles | 5-Miles | ||
---|---|---|---|---|
Total Population | 1,347 | 17,641 | 74,967 | |
Population Median Age | 44 | 41 | 39 | |
Population by Age | 0-9 Yrs | 126 (9%) | 2031 (11%) | 9903 (13%) |
10-19 Yrs | 75 (5%) | 2228 (12%) | 9518 (12%) | |
20-29 Yrs | 205 (15%) | 1735 (9%) | 9268 (12%) | |
30-39 Yrs | 240 (17%) | 2536 (14%) | 10691 (14%) | |
40-49 Yrs | 112 (8%) | 2243 (12%) | 9505 (12%) | |
50-59 Yrs | 152 (11%) | 2391 (13%) | 9803 (13%) | |
60-69 Yrs | 220 (16%) | 2400 (13%) | 8635 (11%) | |
70+ Yrs | 217 (16%) | 2076 (11%) | 7644 (10%) | |
Median HH Income | $57,896 | $61,367 | $56,444 | |
Total Household Income | < 24K | 97 (16%) | 1571 (21%) | 7074 (23%) |
25-49K | 163 (27%) | 1485 (20%) | 6505 (21%) | |
50-74K | 130 (21%) | 1273 (17%) | 4678 (15%) | |
75-99K | 77 (12%) | 1027 (14%) | 3666 (12%) | |
100-199K | 100 (16%) | 1329 (18%) | 5386 (18%) | |
200K+ | 29 (4%) | 596 (8%) | 2502 (8%) | |
Highest Education Level | No Diploma | 64 | 1083 | 5420 |
Diploma or GED | 279 | 2891 | 12494 | |
Some College | 216 | 2461 | 10322 | |
Assoc. Degree | 79 | 1054 | 3816 | |
Bachelors Degree | 270 | 3290 | 11989 | |
Higher Degree | 137 | 1774 | 7955 | |
Total Housing Units | 664 | 8,144 | 34,447 | |
--Owner-Occupied | 519 | 5,247 | 19,406 | |
--Renter-Occupied | 77 | 2,035 | 10,405 | |
Owner-Occupied Values | < 100K | 67 | 1248 | 5361 |
100-199K | 253 | 2272 | 6087 | |
200-299K | 131 | 626 | 3138 | |
300-399K | 31 | 334 | 1502 | |
400-499K | 17 | 199 | 896 | |
500K+ | 20 | 568 | 2422 | |
Total Working Age Population | 1,182 | 14,193 | 58,945 | |
In Work Force | 726 | 8,871 | 37,239 | |
Not In Work Force | 456 | 5,322 | 21,707 | |
Workforce Employed | 700 | 8,450 | 34,717 | |
Workforce Unemployed | 26 | 417 | 2,468 | |
Civlian Workforce | 726 | 8,867 | 37,185 | |
Military Workforce | 0 | 3 | 54 | |
Total Households | 596 | 7,281 | 29,811 | |
Family Households | 297 | 4,306 | 18,057 | |
Non-Family Households | 299 | 2,976 | 11,755 | |
Married Couple | 230 | 2,941 | 11,894 | |
Other Family | 67 | 1,365 | 6,163 | |
Married w/Child | 27 | 980 | 4,536 | |
Single Male w/Child | 9 | 20 | 474 | |
Single Female w/Child | 47 | 716 | 2,785 |
Population Change Last Two Decades - Plus Projection
2000 | % | 2010 | % | 2020 | % | 2030 | |
---|---|---|---|---|---|---|---|
Alabama | 4,447,100 | +7 | 4,779,736 | +3 | 4,940,253 | +4 | 5,124,380 |
Jefferson County | 662,047 | -1 | 658,466 | +1 | 662,458 | 0 | 665,244 |
Shelby County | 143,293 | +36 | 195,085 | +15 | 224,628 | +13 | 253,485 |
Total Working Age Population:
Total Households:
Total Working Age Population:
Total Households:
Total Working Age Population:
Total Households: