Multifamily Housing
9724 Eucalyptus Court Santee, CA 92071
9724 Eucalyptus Court Santee, CA 92071
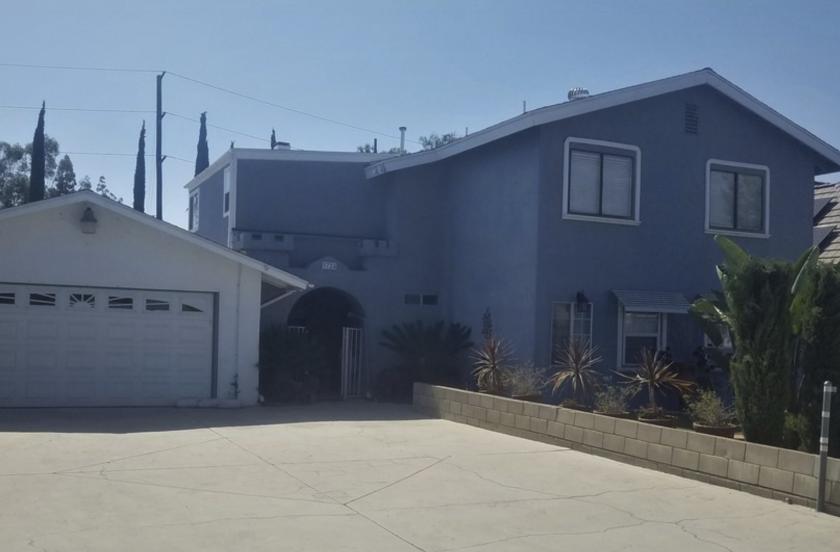
Details & Description
Property Highlights
- • Great location
- • Consistent Revenue Profitable
- • Care givers can stay upon request
- • Strong local recognition great reputation
- • Turn-key operation
- • Large established clientele base
Listing Agents

Melsi Bifsha
EXP Commercial
O: 858-585-1001
melsi.bifsha@expcommercial.com
EXP Commercial
O: 858-585-1001
melsi.bifsha@expcommercial.com
While we strive to provide the most accurate information, all listing information, and demographic data, is provided by third-parties. As such, MyEListing will not be responsible for the accuracy of the information. It is strongly recommended that you verify all information with the listing agent, and any relevant agencies, prior to making any decisions.


