Retail Space
Highland Plaza Strip Highland Heights, OH 44143
Highland Plaza Strip Highland Heights, OH 44143
Details & Description
Property Highlights
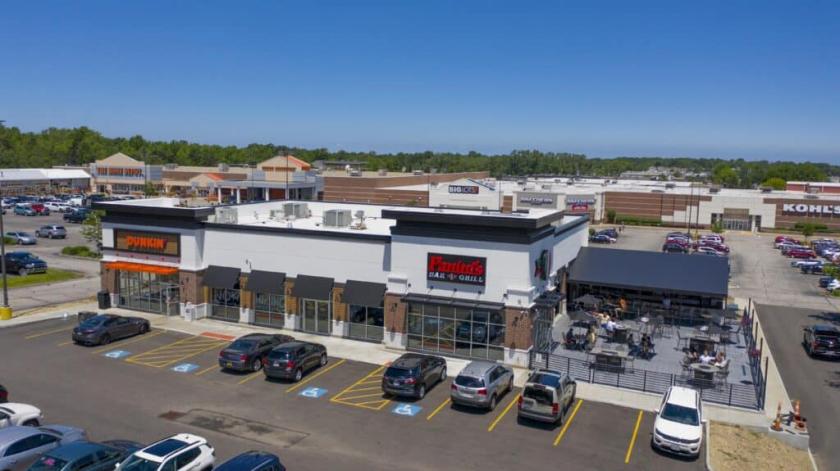
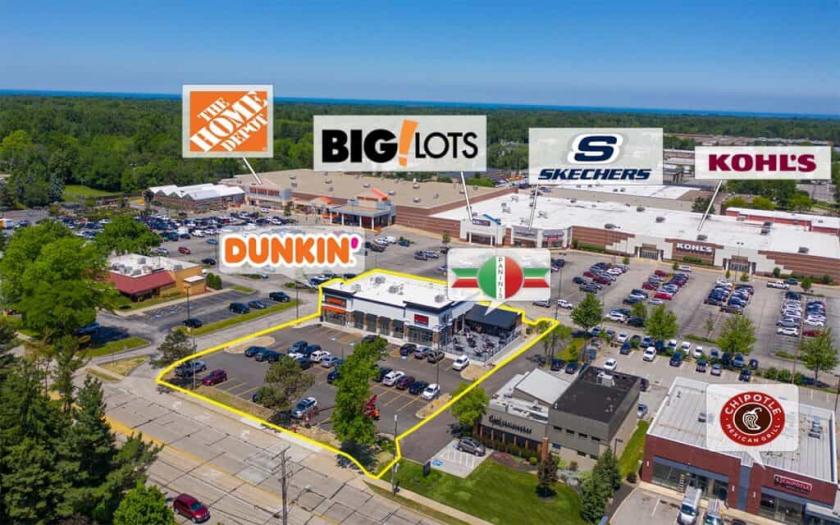
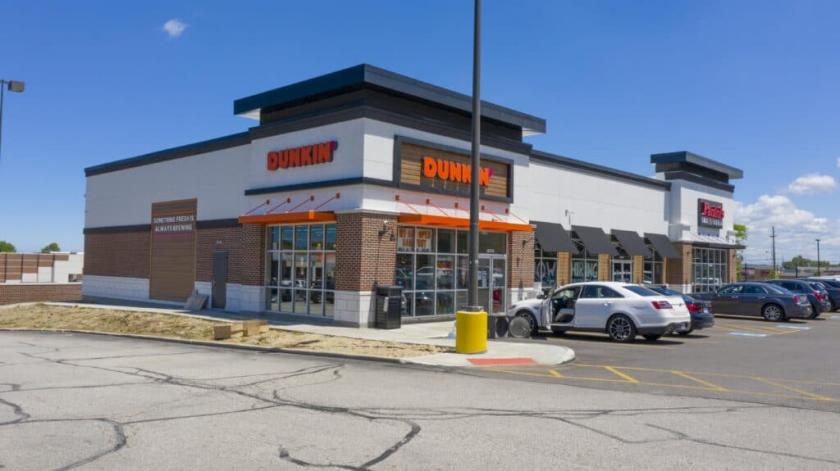
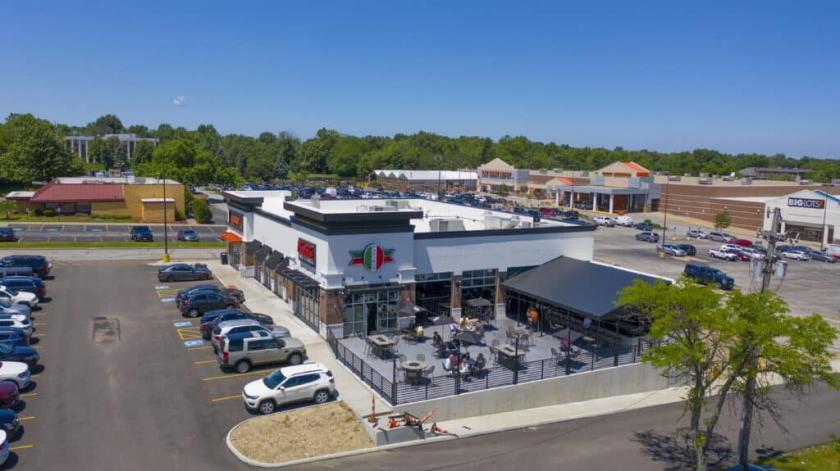
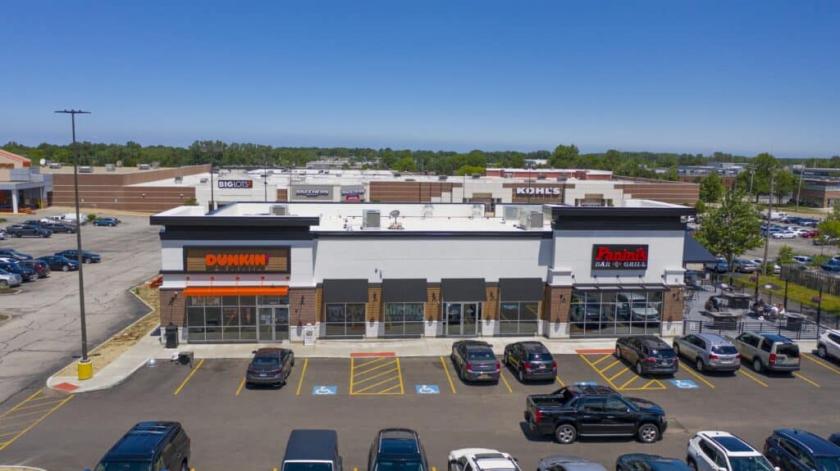
- • Class A Two Tenant Strip Center
- • Brand New Construction
- • New Long Term 10 Year Leases
- • Scheduled Rent Increases Every 5 Years
- • NNN Leases
- • Strong Credit Tenants
Additional Photos
Listing Agents

Rise Retail Group
Rise Retail Group
O: 317-844-0700
info@riseretailgroup.com
Rise Retail Group
O: 317-844-0700
info@riseretailgroup.com
While we strive to provide the most accurate information, all listing information, and demographic data, is provided by third-parties. As such, MyEListing will not be responsible for the accuracy of the information. It is strongly recommended that you verify all information with the listing agent, and any relevant agencies, prior to making any decisions.


