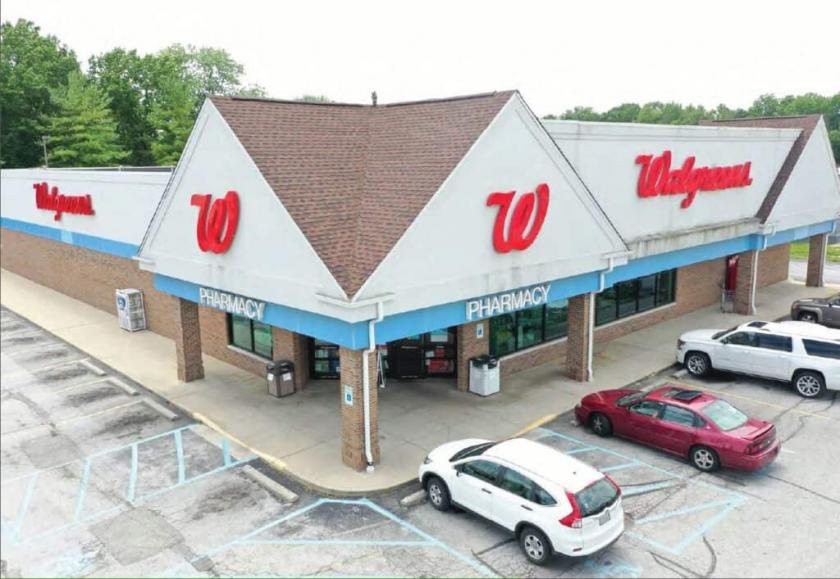
Retail Space
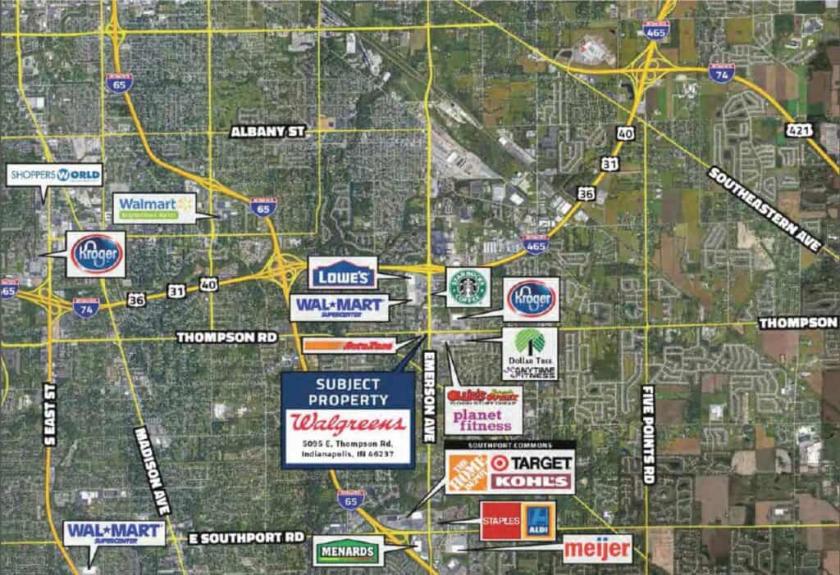
5095 Thompson Road Indianapolis, IN 46237
5095 Thompson Road Indianapolis, IN 46237
Details & Description
Property Highlights
- • Long Term Leasehold Interest Through 2049
- • New Roof Built 2019 Under Warranty
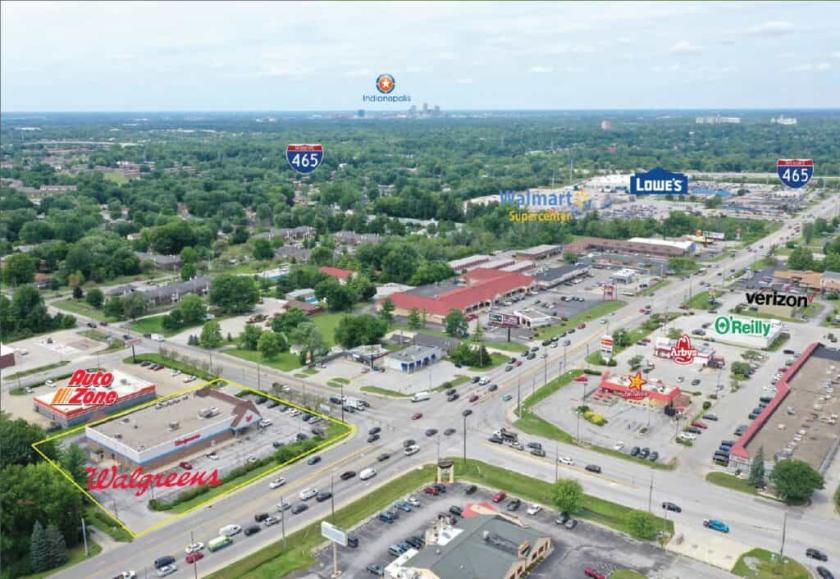
- • High Barriers to Entry
- • Strong Traffic Counts 51,000 CarsDay
- • Long Term Seasoned Tenant
Additional Photos

Listing Agents

Rise Retail Group
Rise Retail Group
O: 317-844-0700
info@riseretailgroup.com
Rise Retail Group
O: 317-844-0700
info@riseretailgroup.com
While we strive to provide the most accurate information, all listing information, and demographic data, is provided by third-parties. As such, MyEListing will not be responsible for the accuracy of the information. It is strongly recommended that you verify all information with the listing agent, and any relevant agencies, prior to making any decisions.


