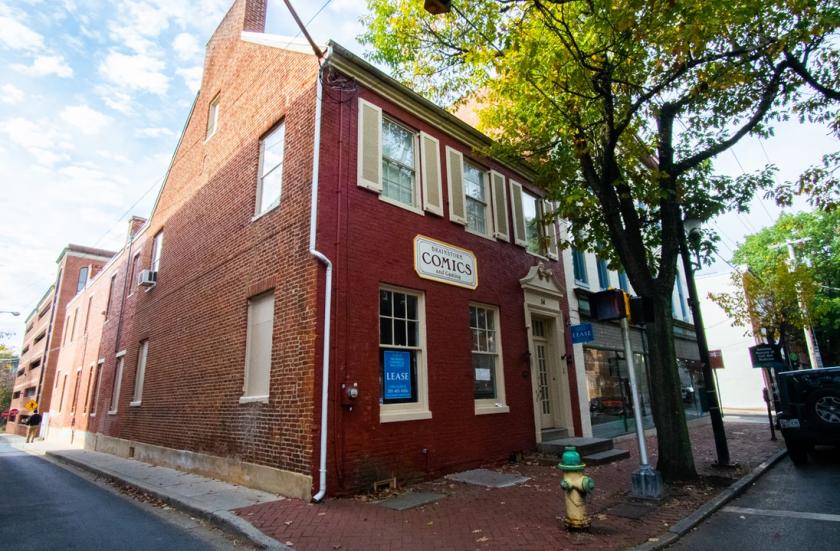
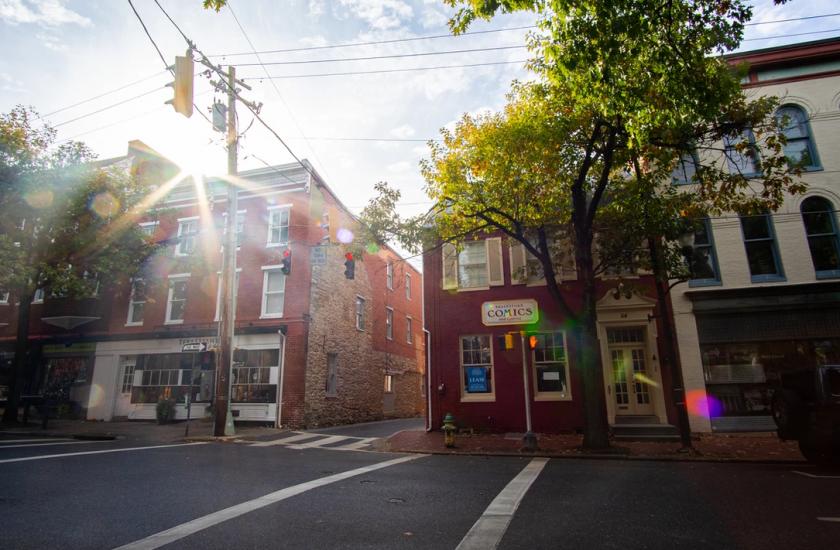
1-Mile | 3-Miles | 5-Miles | ||
---|---|---|---|---|
Total Population | 10,526 | 69,015 | 116,975 | |
Population Median Age | 40 | 37 | 37 | |
Population by Age | 0-9 Yrs | 843 (8%) | 8398 (12%) | 14666 (12%) |
10-19 Yrs | 1029 (9%) | 8416 (12%) | 14979 (12%) | |
20-29 Yrs | 1953 (18%) | 11287 (16%) | 16741 (14%) | |
30-39 Yrs | 1777 (16%) | 11160 (16%) | 17881 (15%) | |
40-49 Yrs | 1182 (11%) | 8848 (12%) | 15530 (13%) | |
50-59 Yrs | 1431 (13%) | 8768 (12%) | 15670 (13%) | |
60-69 Yrs | 1302 (12%) | 6585 (9%) | 11270 (9%) | |
70+ Yrs | 1010 (9%) | 5554 (8%) | 10239 (8%) | |
Median HH Income | $66,725 | $71,621 | $85,521 | |
Total Household Income | < 24K | 865 (17%) | 3777 (13%) | 4924 (10%) |
25-49K | 1031 (20%) | 5389 (19%) | 7670 (17%) | |
50-74K | 868 (17%) | 5307 (19%) | 7323 (16%) | |
75-99K | 730 (14%) | 3671 (13%) | 6003 (13%) | |
100-199K | 1146 (23%) | 7643 (27%) | 14758 (32%) | |
200K+ | 341 (6%) | 1773 (6%) | 4209 (9%) | |
Highest Education Level | No Diploma | 669 | 5230 | 7149 |
Diploma or GED | 1767 | 11393 | 17388 | |
Some College | 1305 | 8723 | 14894 | |
Assoc. Degree | 530 | 3836 | 6325 | |
Bachelors Degree | 1883 | 10293 | 18618 | |
Higher Degree | 1640 | 7469 | 14902 | |
Total Housing Units | 5,508 | 29,450 | 47,720 | |
--Owner-Occupied | 2,556 | 14,902 | 28,682 | |
--Renter-Occupied | 2,425 | 12,656 | 16,205 | |
Owner-Occupied Values | < 100K | 52 | 376 | 614 |
100-199K | 477 | 3287 | 4495 | |
200-299K | 778 | 5842 | 10729 | |
300-399K | 517 | 2959 | 6352 | |
400-499K | 328 | 1542 | 3879 | |
500K+ | 403 | 895 | 2612 | |
Total Working Age Population | 9,185 | 55,465 | 92,866 | |
In Work Force | 6,516 | 40,074 | 66,620 | |
Not In Work Force | 2,669 | 15,391 | 26,246 | |
Workforce Employed | 6,306 | 37,860 | 63,177 | |
Workforce Unemployed | 202 | 1,904 | 2,973 | |
Civlian Workforce | 6,508 | 39,764 | 66,150 | |
Military Workforce | 8 | 309 | 470 | |
Total Households | 4,980 | 27,558 | 44,887 | |
Family Households | 2,407 | 16,480 | 29,417 | |
Non-Family Households | 2,573 | 11,078 | 15,470 | |
Married Couple | 1,711 | 11,657 | 21,783 | |
Other Family | 697 | 4,822 | 7,634 | |
Married w/Child | 581 | 5,478 | 10,128 | |
Single Male w/Child | 40 | 803 | 1,342 | |
Single Female w/Child | 257 | 1,915 | 2,916 |
Population Change Last Two Decades - Plus Projection
2000 | % | 2010 | % | 2020 | % | 2030 | |
---|---|---|---|---|---|---|---|
Maryland | 5,296,486 | +9 | 5,773,552 | +6 | 6,141,900 | +6 | 6,518,750 |
Frederick County | 195,277 | +20 | 233,385 | +12 | 260,800 | +16 | 303,600 |
Montgomery County | 873,341 | +11 | 971,777 | +8 | 1,052,050 | +7 | 1,128,800 |
Washington County | 131,923 | +12 | 147,430 | +6 | 156,800 | +12 | 175,400 |
Total Working Age Population:
Total Households:
Total Working Age Population:
Total Households:
Total Working Age Population:
Total Households: