Retail Space
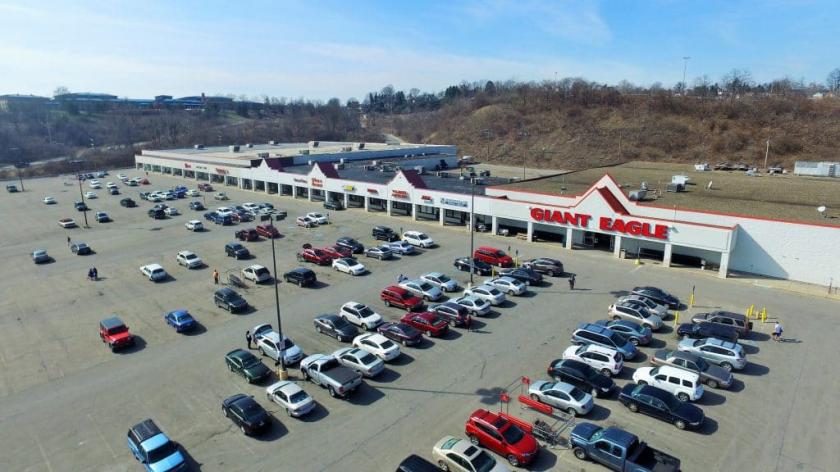
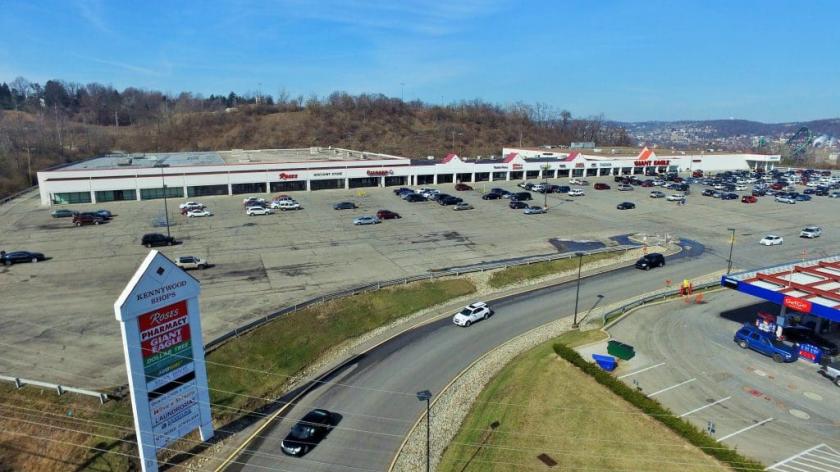
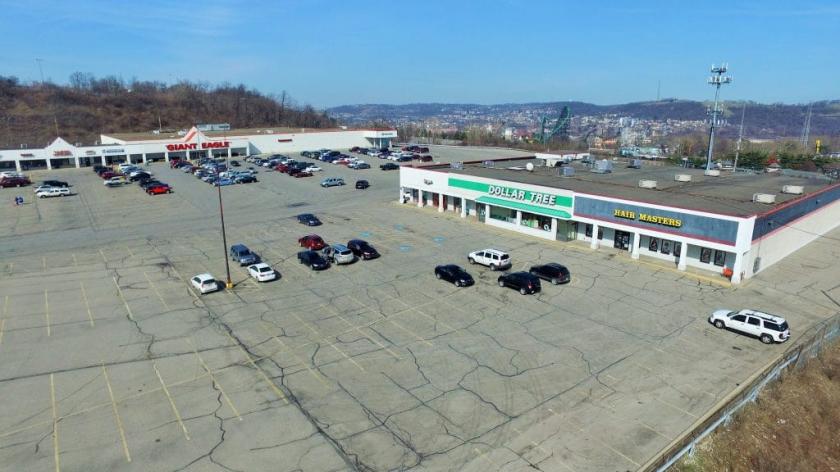
Kennywood Shops West Mifflin, PA 15122
Kennywood Shops West Mifflin, PA 15122
Details & Description
Property Highlights
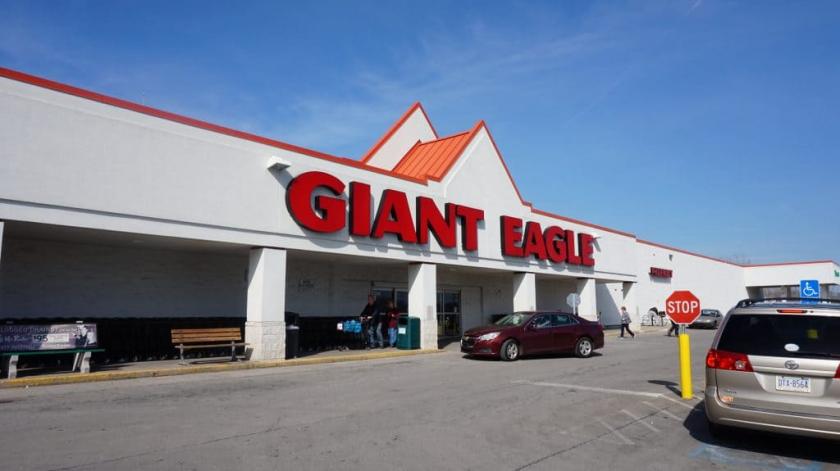
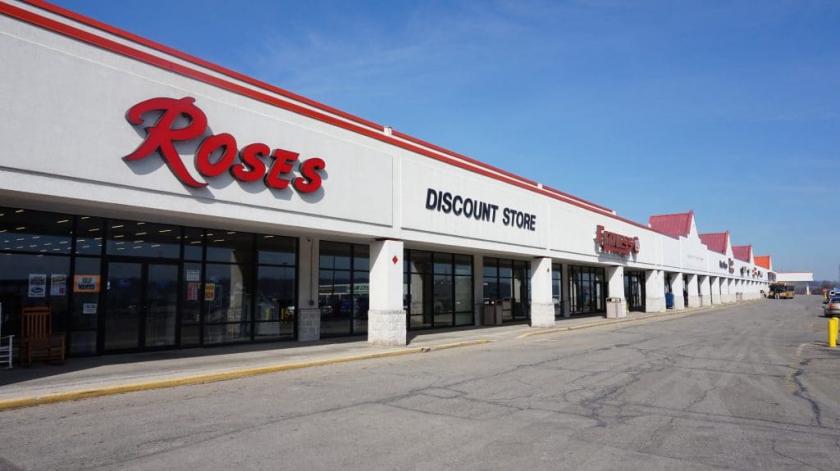
- • Giant Eagle Grocery Anchored Center
- • Long Term Anchor Lease
- • Strong Giant Eagle Sales $455sf
- • Below Market Rents
- • Rents Only Average $5.39sf
- • Schedule Rent Increases
Additional Photos
Listing Agents

Rise Retail Group
Rise Retail Group
O: 317-844-0700
info@riseretailgroup.com
Rise Retail Group
O: 317-844-0700
info@riseretailgroup.com
While we strive to provide the most accurate information, all listing information, and demographic data, is provided by third-parties. As such, MyEListing will not be responsible for the accuracy of the information. It is strongly recommended that you verify all information with the listing agent, and any relevant agencies, prior to making any decisions.


