Industrial Properties
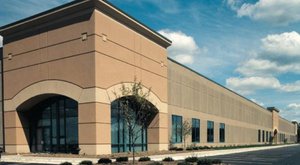
1245 Trapp Road Eagan, MN 55121
1245 Trapp Road Eagan, MN 55121

Details & Description
Property Highlights
- • End cap space
- • 24 clear height
- • 24 clear height
- • 40 x 40 column spacing
- • 8 docks 1 drive-in door
- • ESFR sprinkler system
Listing Agents

Susan Bergdoll
O: 847-232-5420
susan.bergdoll@dukerealty.com
O: 847-232-5420
susan.bergdoll@dukerealty.com
While we strive to provide the most accurate information, all listing information, and demographic data, is provided by third-parties. As such, MyEListing will not be responsible for the accuracy of the information. It is strongly recommended that you verify all information with the listing agent, and any relevant agencies, prior to making any decisions.