Industrial Properties
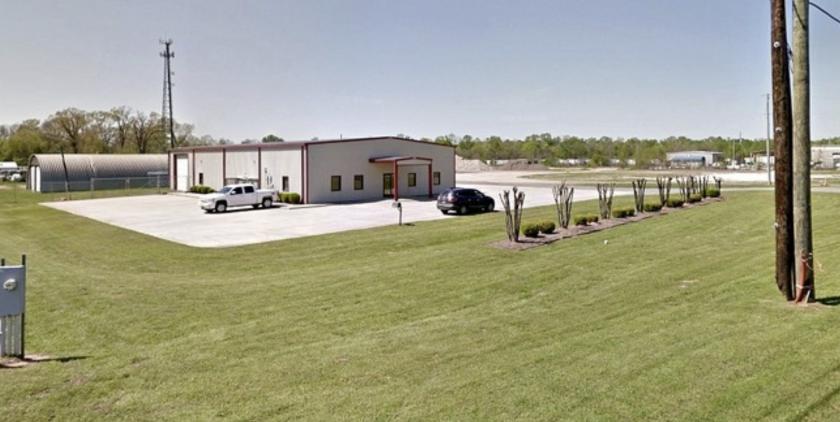
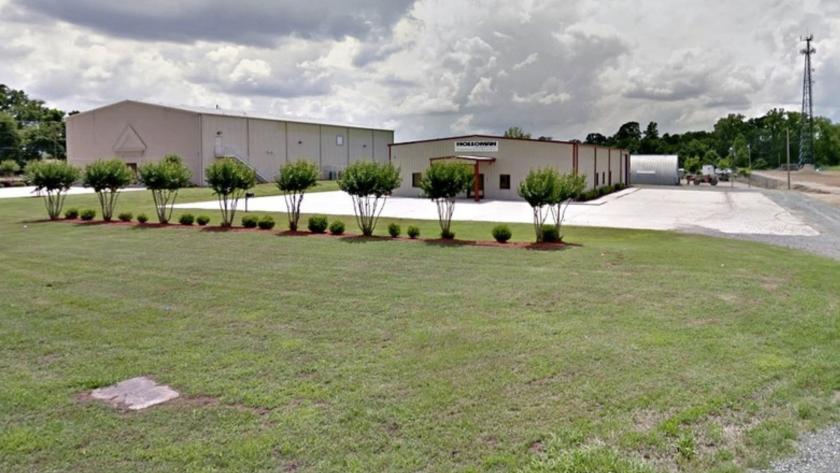
815 Hislope Street Shreveport, LA 71107
815 Hislope Street Shreveport, LA 71107
Details & Description
Listing Agents

Roland Ricou
O: 318-773-3357
M: 318-698-1109
rolandr@sealynet.com
O: 318-773-3357
M: 318-698-1109
rolandr@sealynet.com
While we strive to provide the most accurate information, all listing information, and demographic data, is provided by third-parties. As such, MyEListing will not be responsible for the accuracy of the information. It is strongly recommended that you verify all information with the listing agent, and any relevant agencies, prior to making any decisions.