Office Space
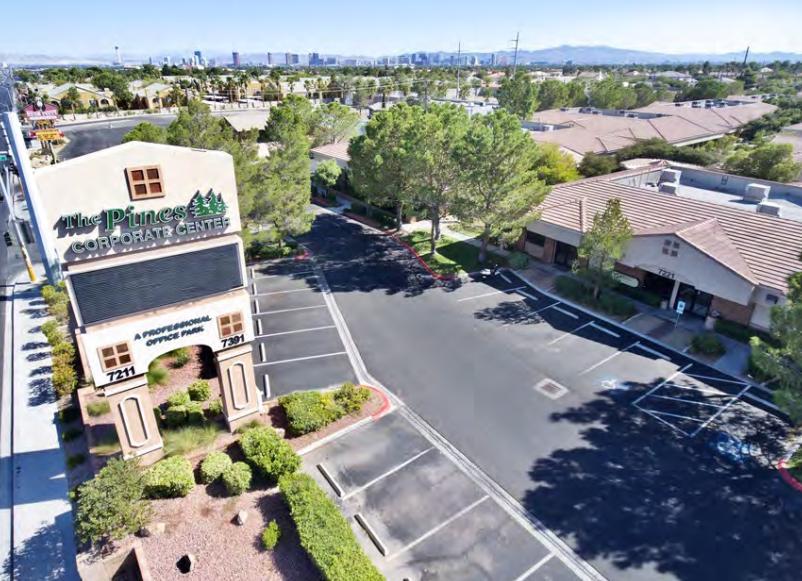
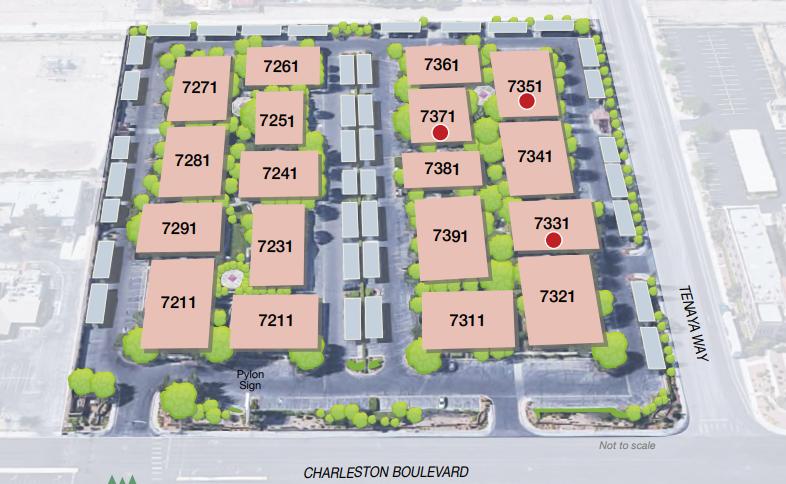
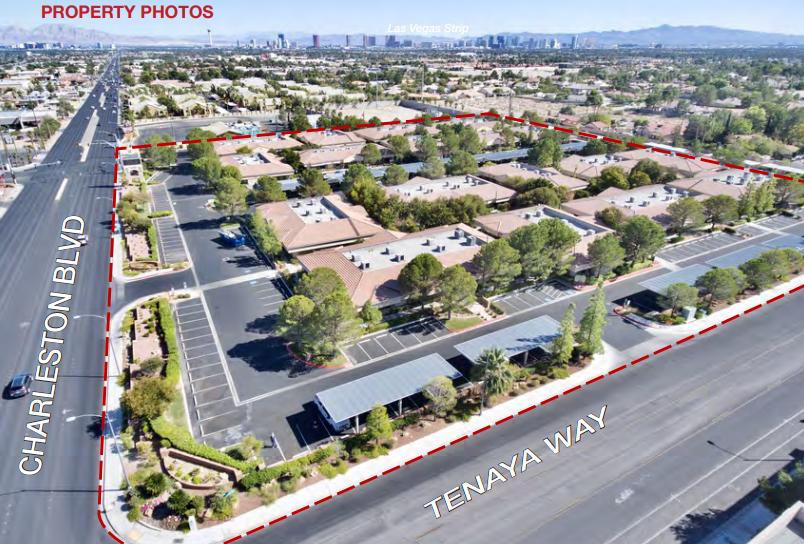
7211 West Charleston Boulevard Las Vegas, NV 89117
7211 West Charleston Boulevard Las Vegas, NV 89117
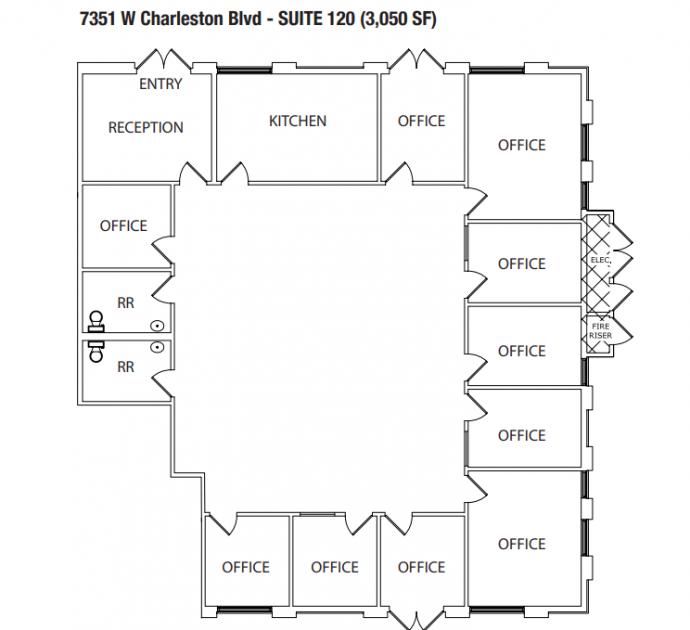
Details & Description
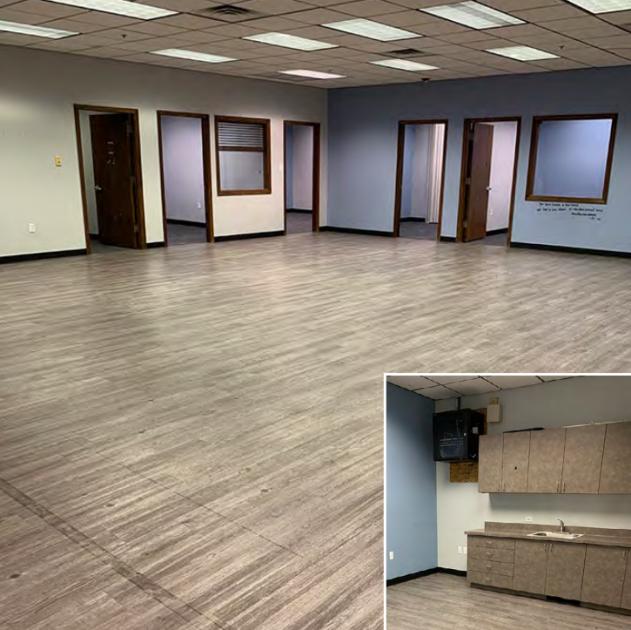
Additional Photos
Listing Agents

Geri Jameson
O: 702-787-0123
geri@virtusco.com
O: 702-787-0123
geri@virtusco.com
While we strive to provide the most accurate information, all listing information, and demographic data, is provided by third-parties. As such, MyEListing will not be responsible for the accuracy of the information. It is strongly recommended that you verify all information with the listing agent, and any relevant agencies, prior to making any decisions.


