Industrial Properties
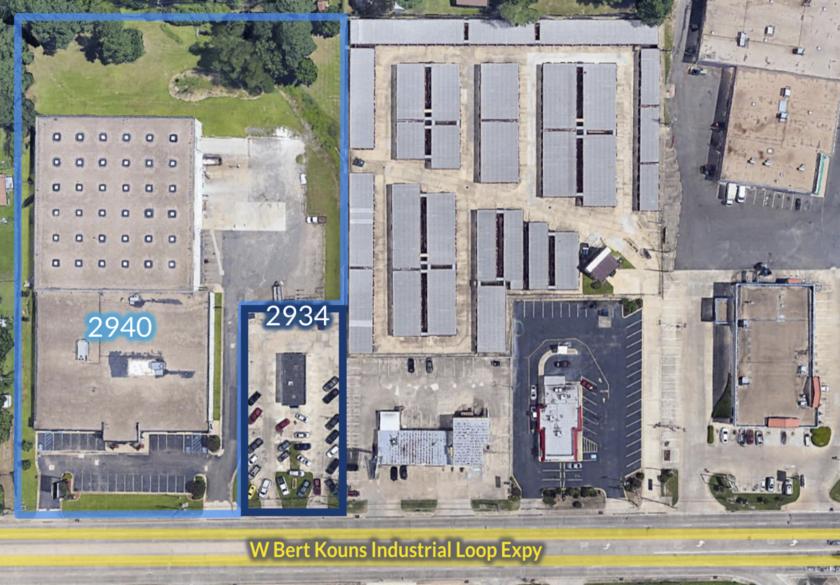
2934 West Bert Kouns Industrial Loop Shreveport, LA 71118
2934 West Bert Kouns Industrial Loop Shreveport, LA 71118
Details & Description
Listing Agents

JoAnn Wheless
O: 318-698-1111
M: 318-458-2667
joannw@sealynet.com
O: 318-698-1111
M: 318-458-2667
joannw@sealynet.com
While we strive to provide the most accurate information, all listing information, and demographic data, is provided by third-parties. As such, MyEListing will not be responsible for the accuracy of the information. It is strongly recommended that you verify all information with the listing agent, and any relevant agencies, prior to making any decisions.