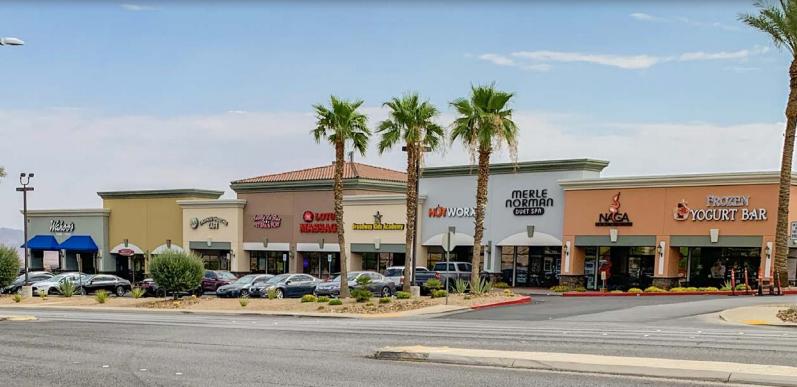
Retail Space
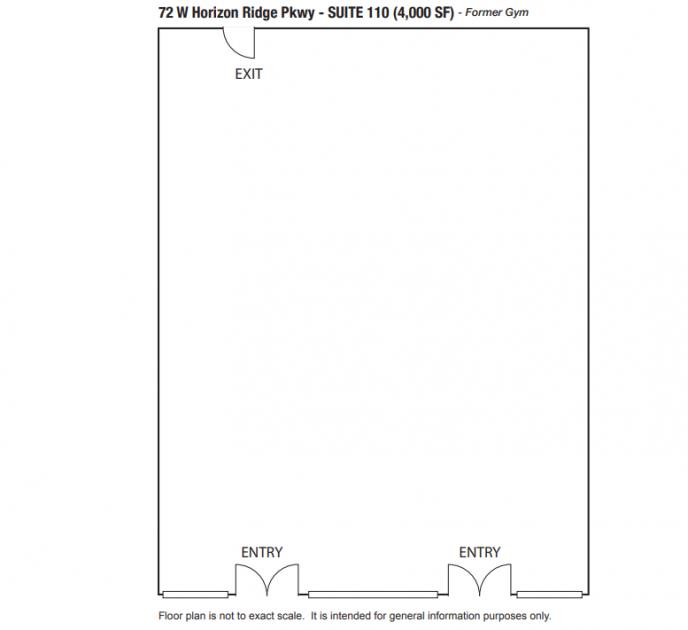
72 West Horizon Ridge Parkway Henderson, NV 89012
72 West Horizon Ridge Parkway Henderson, NV 89012
Details & Description
Property Highlights
- • SEEKING ALL FOOD CONCEPTS
- • $85,000 avg. surrounding household incomes.
- • Huge 94,500 freeway traffic count.
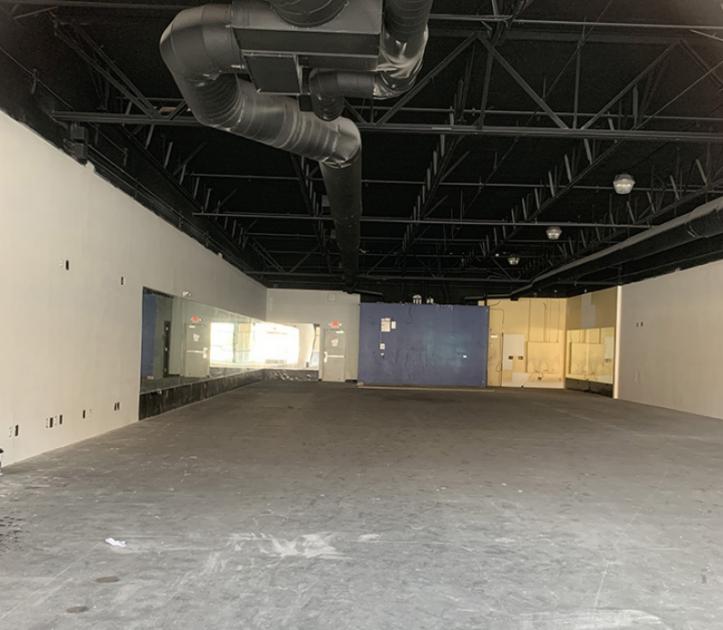
Additional Photos

Listing Agents

Geri Jameson
O: 702-787-0123
geri@virtusco.com
O: 702-787-0123
geri@virtusco.com
While we strive to provide the most accurate information, all listing information, and demographic data, is provided by third-parties. As such, MyEListing will not be responsible for the accuracy of the information. It is strongly recommended that you verify all information with the listing agent, and any relevant agencies, prior to making any decisions.


