Industrial Properties
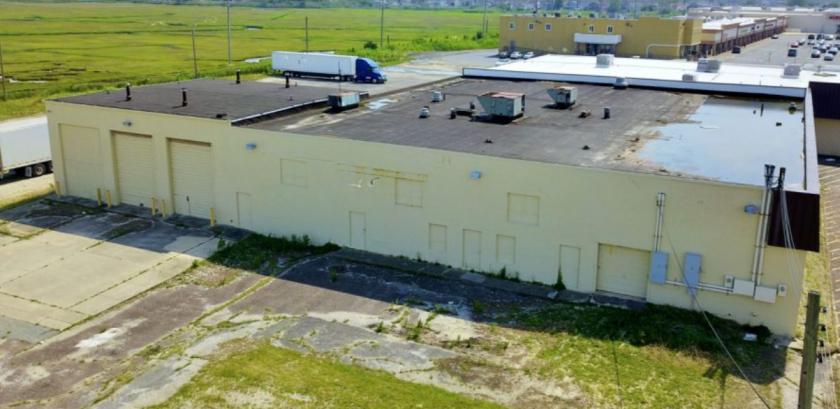
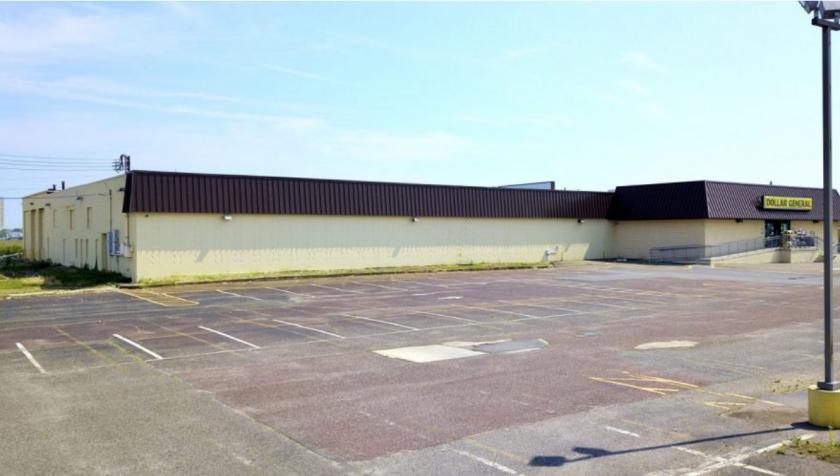
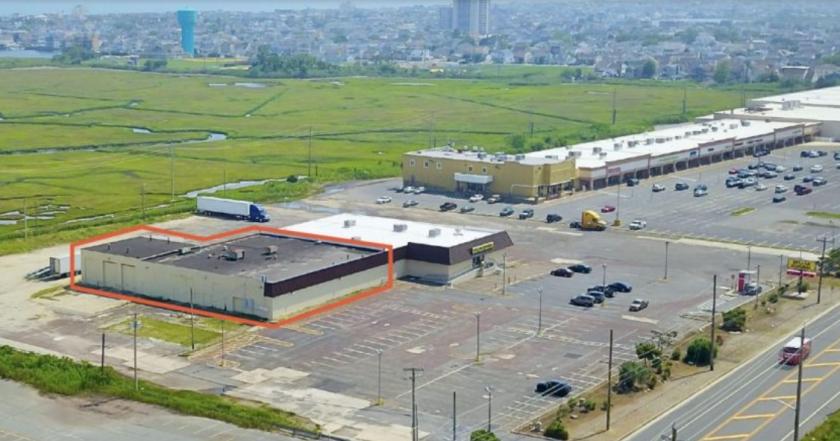
4900 Wellington Avenue Ventnor City, NJ 08406
4900 Wellington Avenue Ventnor City, NJ 08406
Details & Description
Listing Agents

Vincent Ceroli
O: 856-797-1919
vince.ceroli@vantageres.com
O: 856-797-1919
vince.ceroli@vantageres.com
While we strive to provide the most accurate information, all listing information, and demographic data, is provided by third-parties. As such, MyEListing will not be responsible for the accuracy of the information. It is strongly recommended that you verify all information with the listing agent, and any relevant agencies, prior to making any decisions.