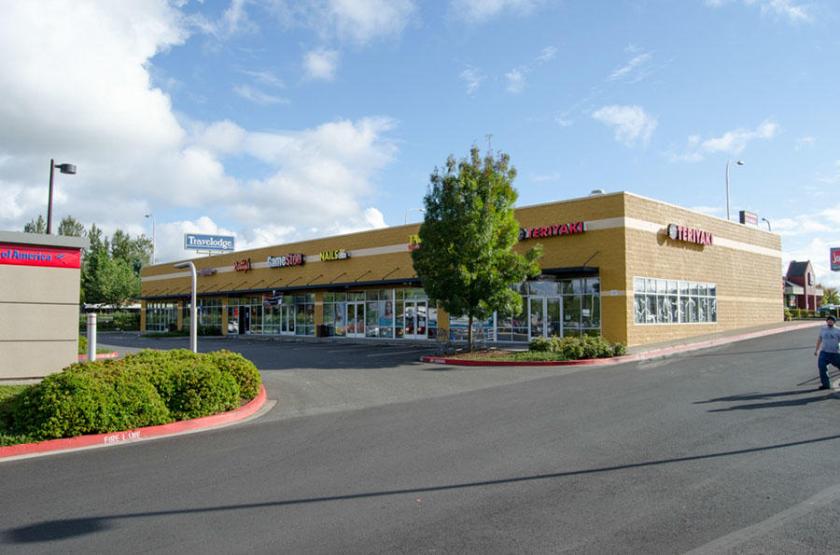
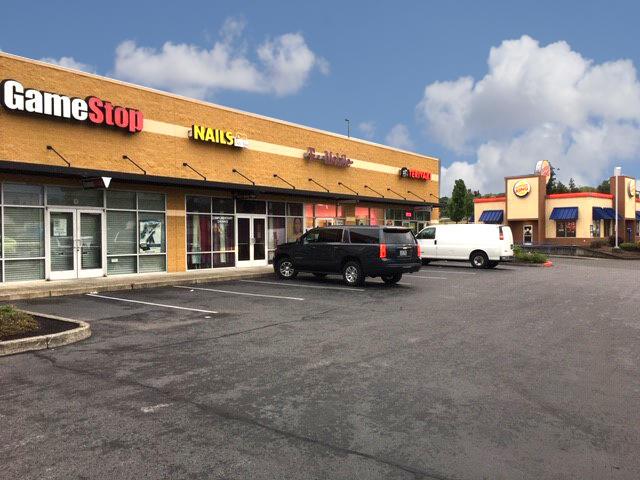
1-Mile | 3-Miles | 5-Miles | ||
---|---|---|---|---|
Total Population | 8,169 | 73,264 | 213,126 | |
Population Median Age | 35 | 37 | 37 | |
Population by Age | 0-9 Yrs | 1426 (17%) | 10049 (13%) | 28945 (13%) |
10-19 Yrs | 873 (10%) | 9218 (12%) | 28480 (13%) | |
20-29 Yrs | 1143 (13%) | 10697 (14%) | 26566 (12%) | |
30-39 Yrs | 1174 (14%) | 11048 (15%) | 31576 (14%) | |
40-49 Yrs | 1348 (16%) | 9640 (13%) | 29119 (13%) | |
50-59 Yrs | 1053 (12%) | 8940 (12%) | 27246 (12%) | |
60-69 Yrs | 756 (9%) | 7744 (10%) | 22458 (10%) | |
70+ Yrs | 395 (4%) | 5928 (8%) | 18735 (8%) | |
Median HH Income | $58,103 | $55,100 | $60,650 | |
Total Household Income | < 24K | 420 (15%) | 5091 (18%) | 13889 (18%) |
25-49K | 681 (24%) | 7071 (26%) | 17717 (23%) | |
50-74K | 662 (24%) | 5403 (19%) | 14222 (18%) | |
75-99K | 465 (16%) | 3662 (13%) | 10478 (13%) | |
100-199K | 435 (15%) | 5164 (19%) | 17012 (22%) | |
200K+ | 74 (2%) | 713 (2%) | 3615 (4%) | |
Highest Education Level | No Diploma | 1071 | 6994 | 18705 |
Diploma or GED | 1559 | 13252 | 35918 | |
Some College | 1525 | 13666 | 38643 | |
Assoc. Degree | 389 | 5097 | 13740 | |
Bachelors Degree | 575 | 7100 | 23683 | |
Higher Degree | 240 | 3013 | 12839 | |
Total Housing Units | 2,920 | 28,722 | 81,596 | |
--Owner-Occupied | 1,619 | 14,125 | 45,792 | |
--Renter-Occupied | 1,118 | 12,980 | 31,140 | |
Owner-Occupied Values | < 100K | 384 | 1749 | 3378 |
100-199K | 138 | 1643 | 4949 | |
200-299K | 462 | 5265 | 14464 | |
300-399K | 516 | 4041 | 13642 | |
400-499K | 83 | 725 | 5173 | |
500K+ | 36 | 700 | 4186 | |
Total Working Age Population | 6,141 | 57,483 | 165,897 | |
In Work Force | 4,370 | 38,926 | 108,200 | |
Not In Work Force | 1,770 | 18,557 | 57,697 | |
Workforce Employed | 4,155 | 36,681 | 102,007 | |
Workforce Unemployed | 216 | 2,243 | 6,080 | |
Civlian Workforce | 4,370 | 38,925 | 108,087 | |
Military Workforce | 0 | 2 | 113 | |
Total Households | 2,737 | 27,104 | 76,933 | |
Family Households | 1,830 | 17,445 | 51,915 | |
Non-Family Households | 906 | 9,660 | 25,018 | |
Married Couple | 1,194 | 11,961 | 37,307 | |
Other Family | 636 | 5,483 | 14,608 | |
Married w/Child | 557 | 5,275 | 16,630 | |
Single Male w/Child | 158 | 842 | 2,128 | |
Single Female w/Child | 219 | 1,950 | 6,039 |
Population Change Last Two Decades - Plus Projection
2000 | % | 2010 | % | 2020 | % | 2030 | |
---|---|---|---|---|---|---|---|
Oregon | 3,421,399 | +12 | 3,831,074 | +11 | 4,264,810 | +11 | 4,727,438 |
Multnomah County | 660,486 | +11 | 735,334 | +12 | 822,675 | +10 | 906,904 |
Washington | 5,894,121 | +14 | 6,724,540 | +14 | 7,638,415 | +11 | 8,503,178 |
Clark County | 345,238 | +23 | 425,363 | +17 | 499,400 | +16 | 576,879 |
Total Working Age Population:
Total Households:
Total Working Age Population:
Total Households:
Total Working Age Population:
Total Households: