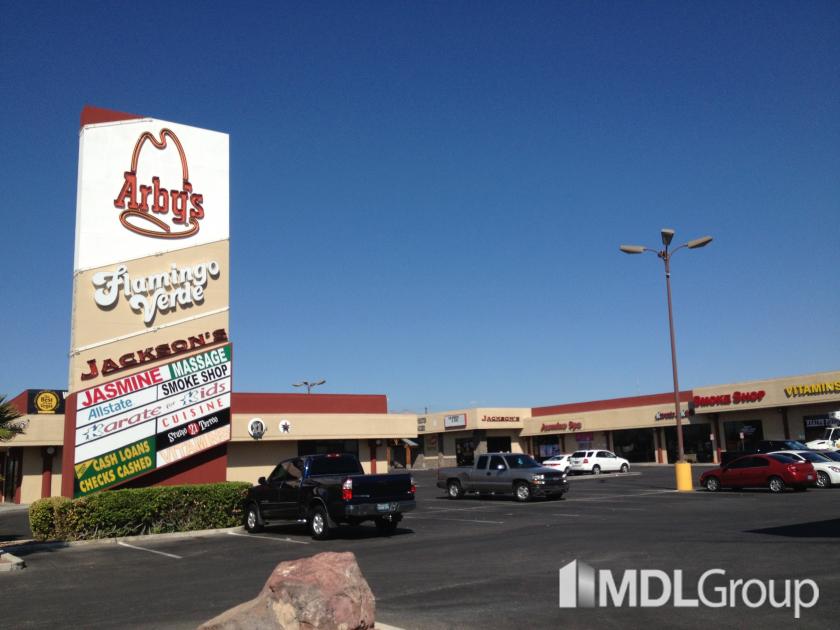
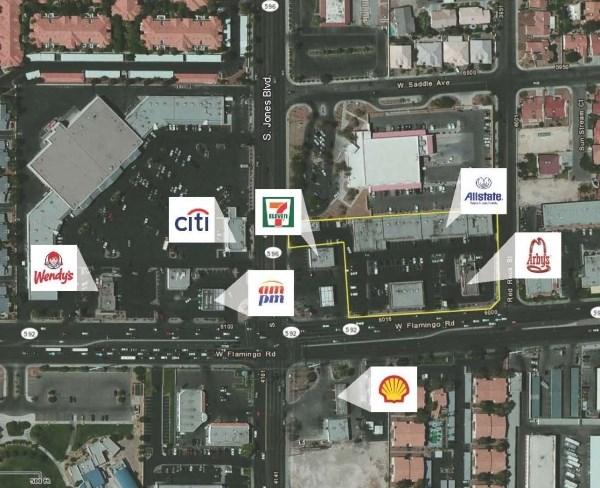
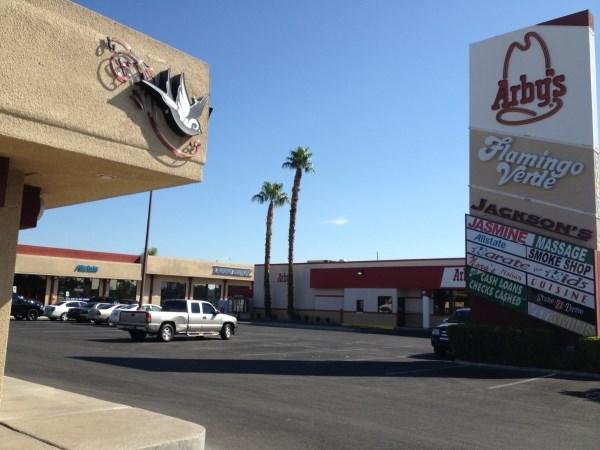
1-Mile | 3-Miles | 5-Miles | ||
---|---|---|---|---|
Total Population | 30,822 | 153,935 | 396,070 | |
Population Median Age | 38 | 39 | 39 | |
Population by Age | 0-9 Yrs | 3678 (11%) | 17650 (11%) | 44703 (11%) |
10-19 Yrs | 3515 (11%) | 17300 (11%) | 44433 (11%) | |
20-29 Yrs | 5230 (16%) | 24112 (15%) | 61821 (15%) | |
30-39 Yrs | 4679 (15%) | 23364 (15%) | 60556 (15%) | |
40-49 Yrs | 3999 (12%) | 20338 (13%) | 53975 (13%) | |
50-59 Yrs | 3506 (11%) | 20198 (13%) | 52658 (13%) | |
60-69 Yrs | 3236 (10%) | 15946 (10%) | 41439 (10%) | |
70+ Yrs | 2980 (9%) | 15026 (9%) | 36485 (9%) | |
Median HH Income | $44,769 | $46,553 | $49,097 | |
Total Household Income | < 24K | 2431 (21%) | 13058 (22%) | 34863 (22%) |
25-49K | 3872 (33%) | 17779 (30%) | 42536 (27%) | |
50-74K | 2384 (20%) | 11188 (19%) | 28999 (19%) | |
75-99K | 1374 (11%) | 6647 (11%) | 18476 (12%) | |
100-199K | 1186 (10%) | 7014 (12%) | 21648 (14%) | |
200K+ | 251 (2%) | 2095 (3%) | 5781 (3%) | |
Highest Education Level | No Diploma | 3832 | 18504 | 43691 |
Diploma or GED | 6784 | 34269 | 84043 | |
Some College | 5351 | 25731 | 70085 | |
Assoc. Degree | 1694 | 8137 | 20917 | |
Bachelors Degree | 2712 | 15205 | 41912 | |
Higher Degree | 1050 | 6522 | 18907 | |
Total Housing Units | 13,266 | 72,195 | 188,339 | |
--Owner-Occupied | 4,568 | 22,483 | 59,926 | |
--Renter-Occupied | 6,931 | 35,300 | 92,377 | |
Owner-Occupied Values | < 100K | 1255 | 3521 | 6129 |
100-199K | 1294 | 6333 | 16239 | |
200-299K | 1439 | 6484 | 18541 | |
300-399K | 457 | 2907 | 9562 | |
400-499K | 83 | 1256 | 3849 | |
500K+ | 40 | 1980 | 5606 | |
Total Working Age Population | 24,858 | 125,251 | 323,972 | |
In Work Force | 16,111 | 83,306 | 216,078 | |
Not In Work Force | 8,747 | 41,945 | 107,895 | |
Workforce Employed | 15,023 | 77,928 | 202,429 | |
Workforce Unemployed | 1,072 | 5,318 | 13,478 | |
Civlian Workforce | 16,095 | 83,246 | 215,908 | |
Military Workforce | 16 | 60 | 170 | |
Total Households | 11,499 | 57,782 | 152,304 | |
Family Households | 6,814 | 33,577 | 85,582 | |
Non-Family Households | 4,685 | 24,205 | 66,722 | |
Married Couple | 4,280 | 19,968 | 52,389 | |
Other Family | 2,534 | 13,609 | 33,193 | |
Married w/Child | 1,552 | 7,429 | 19,958 | |
Single Male w/Child | 449 | 1,769 | 4,582 | |
Single Female w/Child | 781 | 4,737 | 10,963 |
Population Change Last Two Decades - Plus Projection
2000 | % | 2010 | % | 2020 | % | 2030 | |
---|---|---|---|---|---|---|---|
Nevada | 1,998,257 | +35 | 2,700,551 | +17 | 3,149,234 | +10 | 3,460,728 |
Clark County | 1,375,765 | +42 | 1,951,269 | +19 | 2,318,174 | +10 | 2,550,048 |
Nye County | 32,485 | +35 | 43,946 | +11 | 48,864 | +8 | 52,587 |
Total Working Age Population:
Total Households:
Total Working Age Population:
Total Households:
Total Working Age Population:
Total Households: