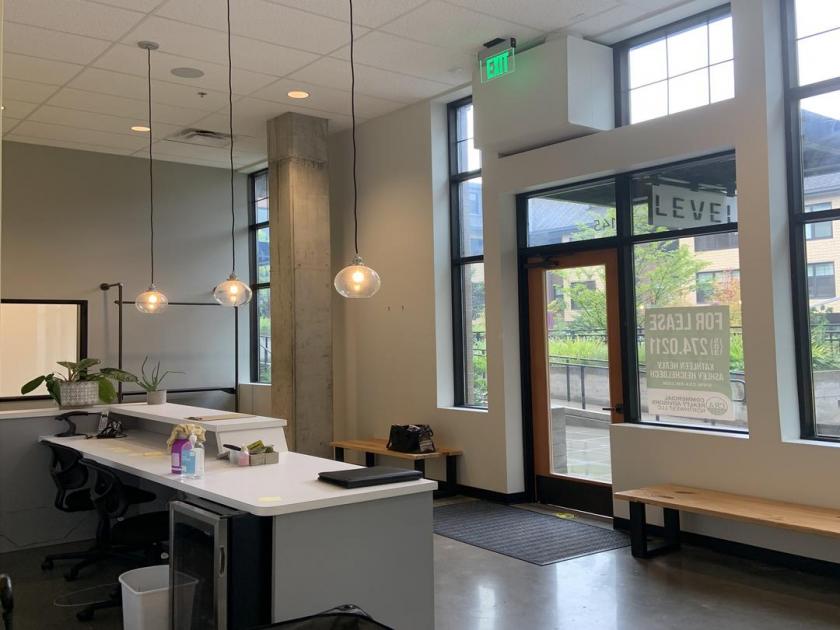
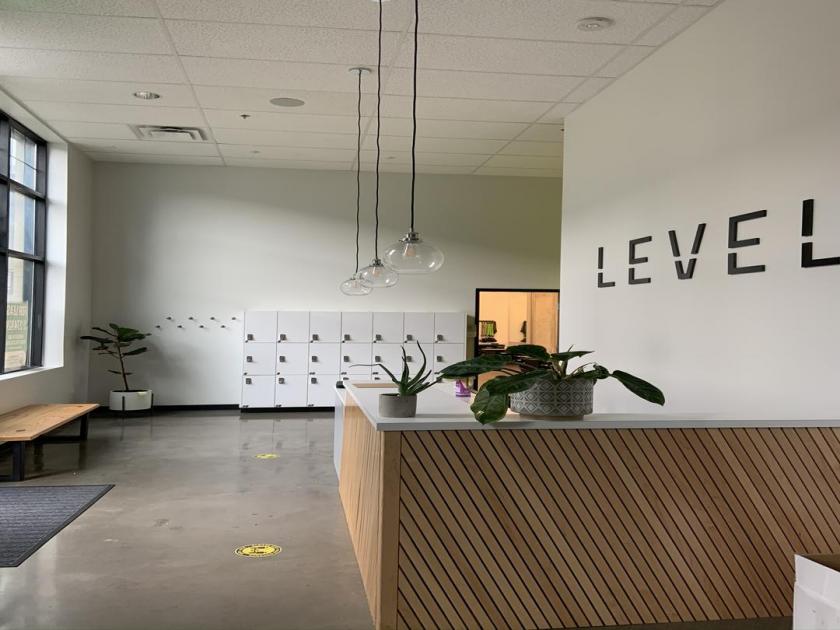
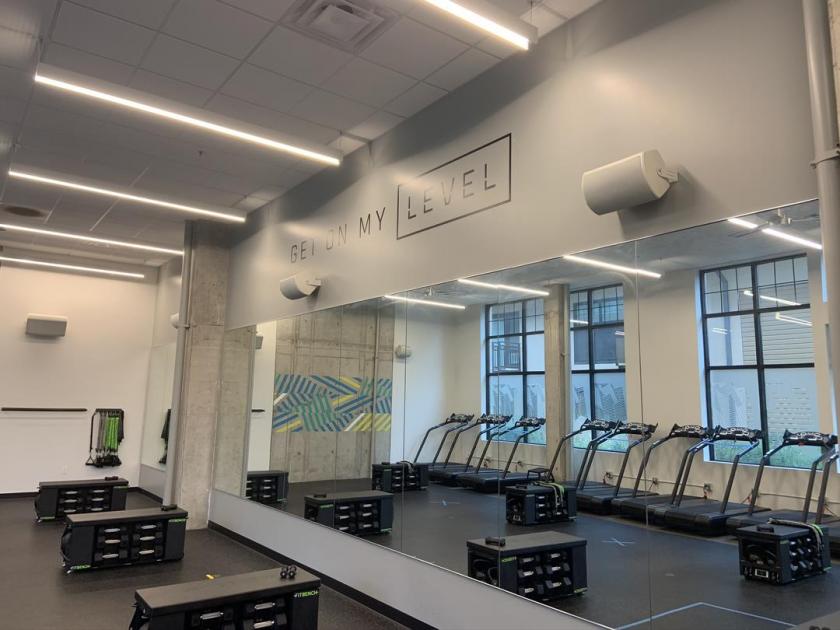
1-Mile | 3-Miles | 5-Miles | ||
---|---|---|---|---|
Total Population | 9,780 | 85,039 | 279,616 | |
Population Median Age | 47 | 43 | 41 | |
Population by Age | 0-9 Yrs | 704 (7%) | 7994 (9%) | 30850 (11%) |
10-19 Yrs | 1070 (10%) | 10040 (11%) | 31690 (11%) | |
20-29 Yrs | 887 (9%) | 9495 (11%) | 33526 (11%) | |
30-39 Yrs | 674 (6%) | 9810 (11%) | 40835 (14%) | |
40-49 Yrs | 1379 (14%) | 11265 (13%) | 37602 (13%) | |
50-59 Yrs | 1547 (15%) | 12253 (14%) | 37240 (13%) | |
60-69 Yrs | 1781 (18%) | 12479 (14%) | 36349 (12%) | |
70+ Yrs | 1737 (17%) | 11702 (13%) | 31525 (11%) | |
Median HH Income | $94,228 | $86,946 | $82,617 | |
Total Household Income | < 24K | 511 (11%) | 4393 (12%) | 15398 (13%) |
25-49K | 666 (14%) | 5916 (16%) | 18850 (16%) | |
50-74K | 631 (14%) | 5471 (15%) | 18494 (16%) | |
75-99K | 565 (12%) | 4296 (12%) | 15587 (13%) | |
100-199K | 1249 (27%) | 9759 (27%) | 30713 (26%) | |
200K+ | 862 (19%) | 5831 (16%) | 15941 (13%) | |
Highest Education Level | No Diploma | 194 | 2905 | 9961 |
Diploma or GED | 737 | 8234 | 30589 | |
Some College | 1331 | 11995 | 41577 | |
Assoc. Degree | 317 | 4039 | 13882 | |
Bachelors Degree | 2639 | 20712 | 63126 | |
Higher Degree | 2310 | 14759 | 42926 | |
Total Housing Units | 4,809 | 37,678 | 120,502 | |
--Owner-Occupied | 3,067 | 24,848 | 74,375 | |
--Renter-Occupied | 1,417 | 10,818 | 40,607 | |
Owner-Occupied Values | < 100K | 27 | 825 | 2423 |
100-199K | 72 | 1059 | 3262 | |
200-299K | 292 | 3169 | 10730 | |
300-399K | 437 | 4746 | 15928 | |
400-499K | 276 | 3848 | 13608 | |
500K+ | 1963 | 11201 | 28425 | |
Total Working Age Population | 8,353 | 70,902 | 229,273 | |
In Work Force | 4,962 | 45,133 | 152,533 | |
Not In Work Force | 3,391 | 25,769 | 76,740 | |
Workforce Employed | 4,857 | 43,178 | 145,340 | |
Workforce Unemployed | 105 | 1,903 | 7,093 | |
Civlian Workforce | 4,962 | 45,081 | 152,432 | |
Military Workforce | 0 | 53 | 100 | |
Total Households | 4,484 | 35,666 | 114,982 | |
Family Households | 2,834 | 22,639 | 70,224 | |
Non-Family Households | 1,650 | 13,027 | 44,759 | |
Married Couple | 2,377 | 18,777 | 56,387 | |
Other Family | 457 | 3,862 | 13,837 | |
Married w/Child | 737 | 7,033 | 22,277 | |
Single Male w/Child | 72 | 557 | 1,985 | |
Single Female w/Child | 180 | 1,354 | 5,741 |
Population Change Last Two Decades - Plus Projection
2000 | % | 2010 | % | 2020 | % | 2030 | |
---|---|---|---|---|---|---|---|
Oregon | 3,421,399 | +12 | 3,831,074 | +11 | 4,264,810 | +11 | 4,727,438 |
Clackamas County | 338,391 | +11 | 375,992 | +14 | 428,860 | +14 | 490,011 |
Multnomah County | 660,486 | +11 | 735,334 | +12 | 822,675 | +10 | 906,904 |
Washington County | 445,342 | +19 | 529,710 | +17 | 619,337 | +16 | 718,633 |
Total Working Age Population:
Total Households:
Total Working Age Population:
Total Households:
Total Working Age Population:
Total Households: