Office Space
5795 South Sandhill Road Las Vegas, NV 89120
5795 South Sandhill Road Las Vegas, NV 89120

Details & Description
Property Highlights
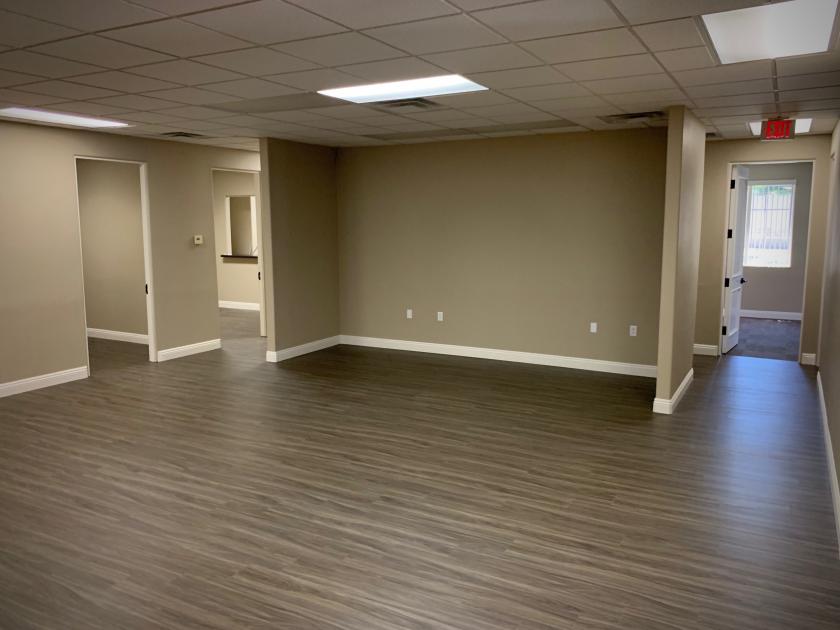
- • 1,490 - 7,750 SF Office suites available
- • Lease rates $1.00 - $1.25 SFNNN
- • Zoning C-P Office and Professional
- • Beautiful Italian style architecture
- • Abundance of parking
- • Many suites are turn-key condition
Listing Agents

David Bauman
O: 702-954-4126
M: 702-460-7013
dbauman@logiccre.com
O: 702-954-4126
M: 702-460-7013
dbauman@logiccre.com
While we strive to provide the most accurate information, all listing information, and demographic data, is provided by third-parties. As such, MyEListing will not be responsible for the accuracy of the information. It is strongly recommended that you verify all information with the listing agent, and any relevant agencies, prior to making any decisions.