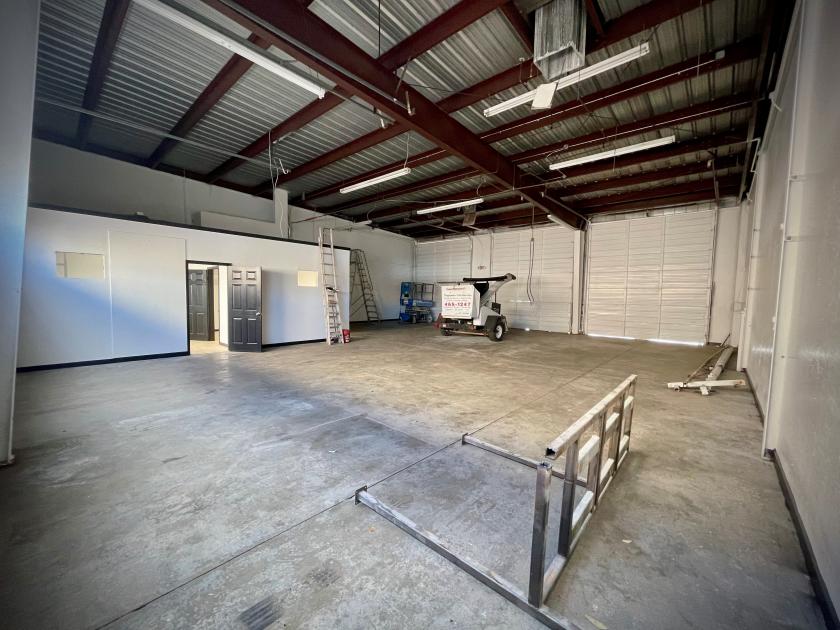
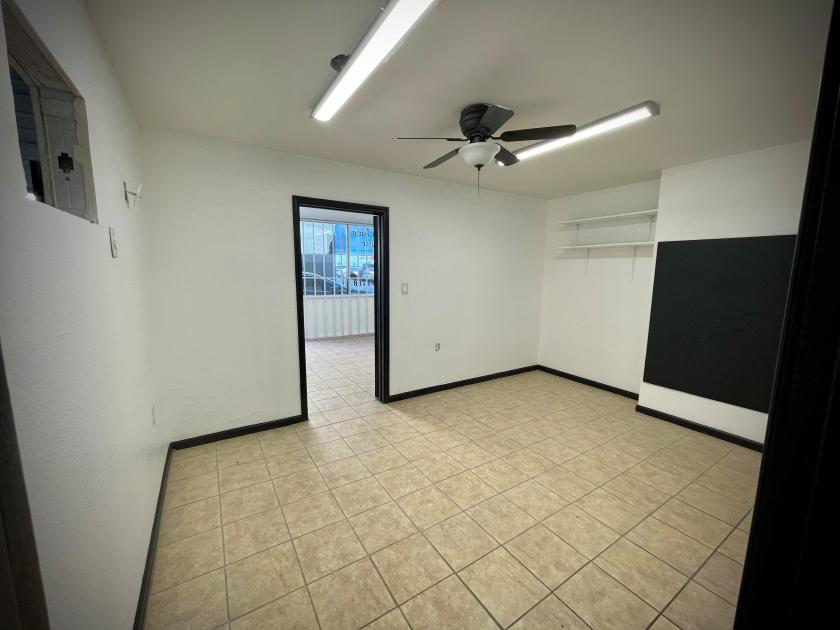
Flex-Office-Warehouse
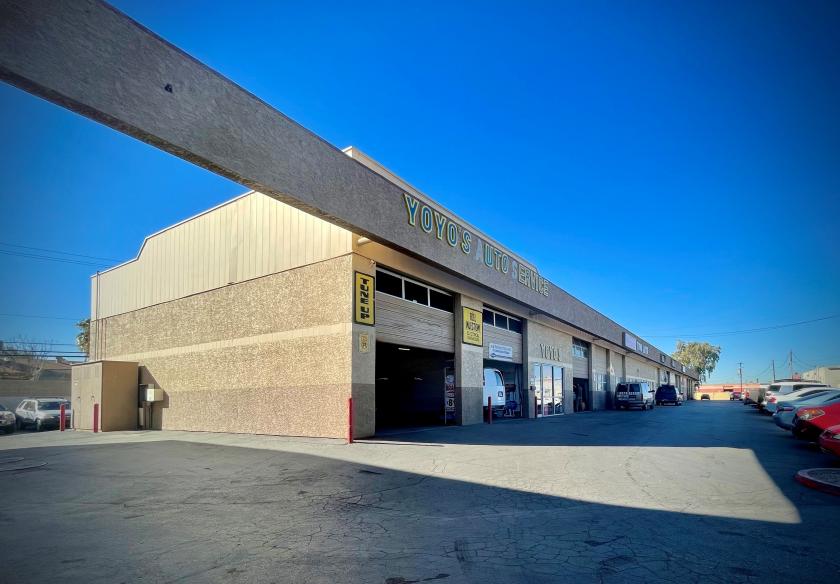
3220 East Fremont Street Las Vegas, NV 89104
3220 East Fremont Street Las Vegas, NV 89104
Details & Description
Property Highlights
- • 2,250 SF Suites available
- • 2.53 Acres
- • Lease rate $1.00 SFNNN, $0.25 PSF CAM
- • Automotive services welcome
- • Zoning C-2 General Commercial
- • Great central location
Listing Agents

David Bauman
O: 702-954-4126
M: 702-460-7013
dbauman@logiccre.com
O: 702-954-4126
M: 702-460-7013
dbauman@logiccre.com
While we strive to provide the most accurate information, all listing information, and demographic data, is provided by third-parties. As such, MyEListing will not be responsible for the accuracy of the information. It is strongly recommended that you verify all information with the listing agent, and any relevant agencies, prior to making any decisions.