Industrial Properties
715 Flinthill Road King Of Prussia, PA 19406
715 Flinthill Road King Of Prussia, PA 19406
Details & Description
Property Highlights
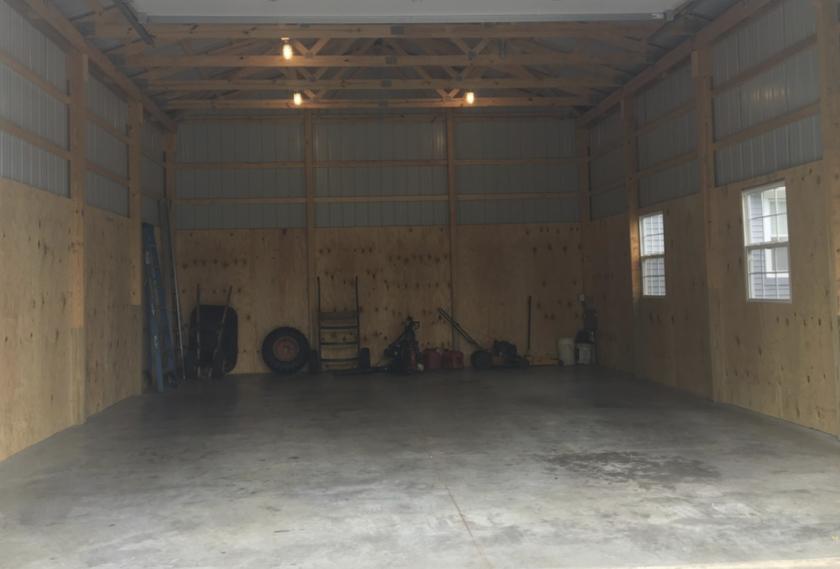
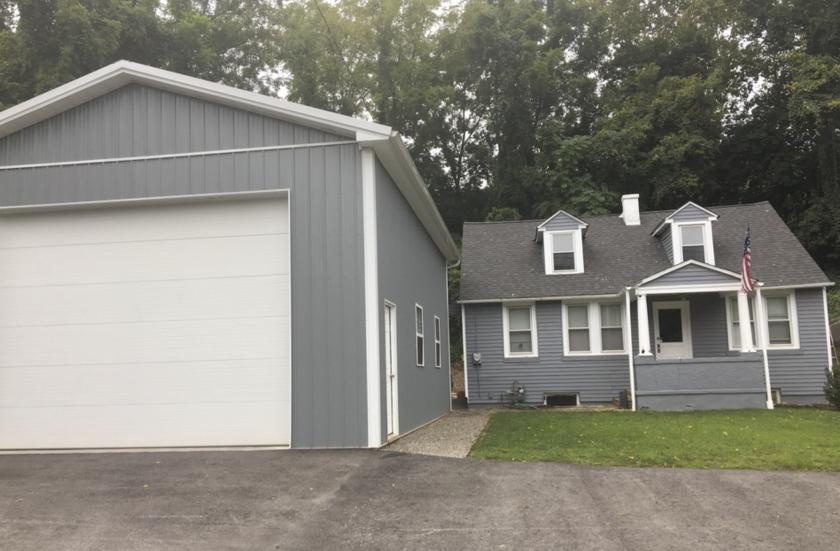
• Approximately - 2,120 SF of Mixed-Use Space Home Office 1,300 SF Warehouse 820 SF
• On-site parking located at the front, and on the east side of the warehouse
Listing Agents

Timothy Pennington
O: 215-448-6000
tpennington@binswanger.com
O: 215-448-6000
tpennington@binswanger.com
While we strive to provide the most accurate information, all listing information, and demographic data, is provided by third-parties. As such, MyEListing will not be responsible for the accuracy of the information. It is strongly recommended that you verify all information with the listing agent, and any relevant agencies, prior to making any decisions.