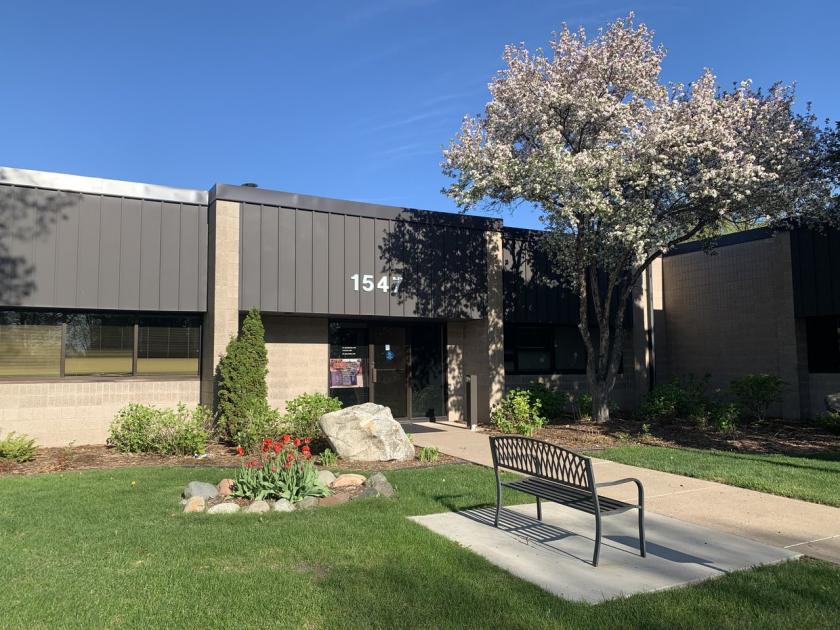
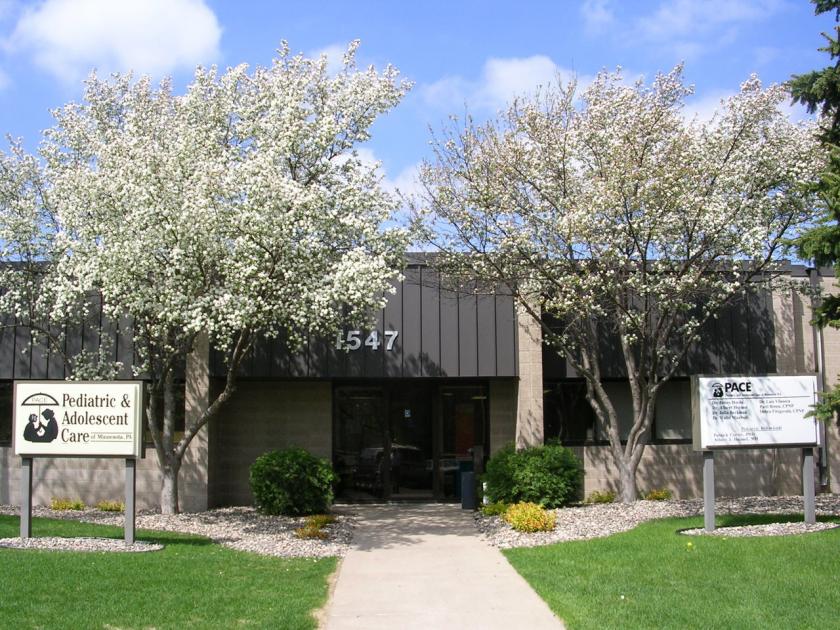
Flex-Office-Warehouse
1545 Livingston Avenue West Saint Paul, MN 55118
1545 Livingston Avenue West Saint Paul, MN 55118
Details & Description
Property Highlights
- • Overhead door is 10
- • Designated free parking
- • On-site property management
- • Solar-powered, energy conscious building
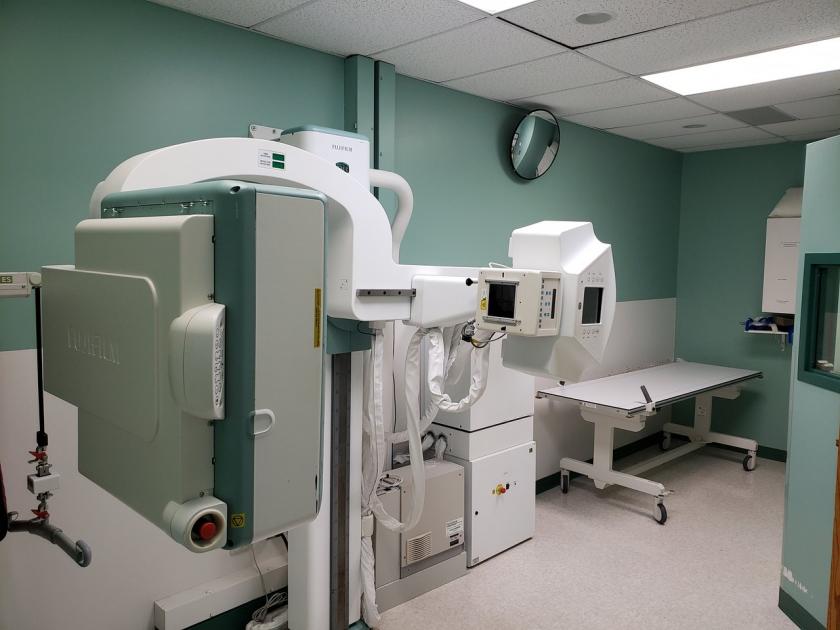
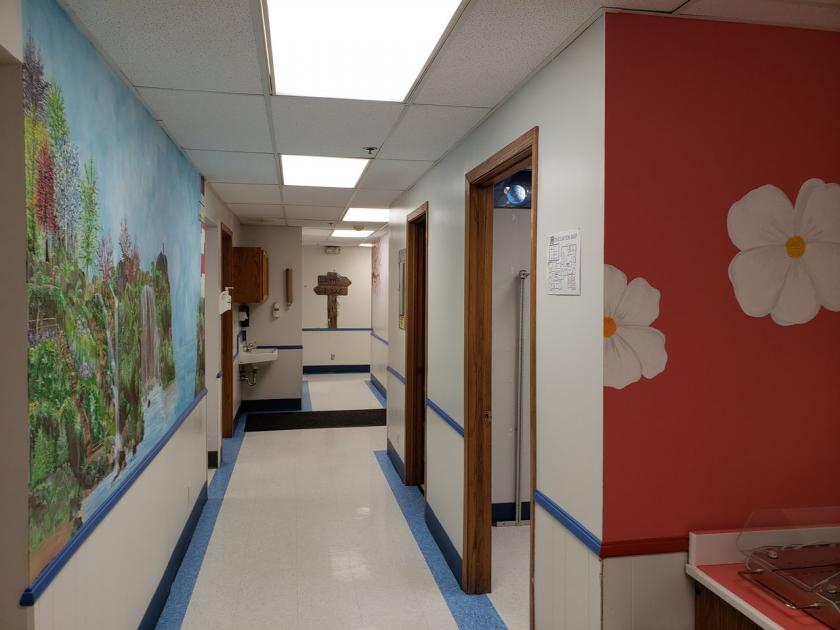
Additional Photos

Listing Agents

Dave Langer
O: 651-450-9669
david@langercommercial.com
O: 651-450-9669
david@langercommercial.com

Kaitlin Simmet
Langer Real Estate
O: 651-450-9669
kaitlin@langercommercial.com
Langer Real Estate
O: 651-450-9669
kaitlin@langercommercial.com
While we strive to provide the most accurate information, all listing information, and demographic data, is provided by third-parties. As such, MyEListing will not be responsible for the accuracy of the information. It is strongly recommended that you verify all information with the listing agent, and any relevant agencies, prior to making any decisions.


