Industrial Properties
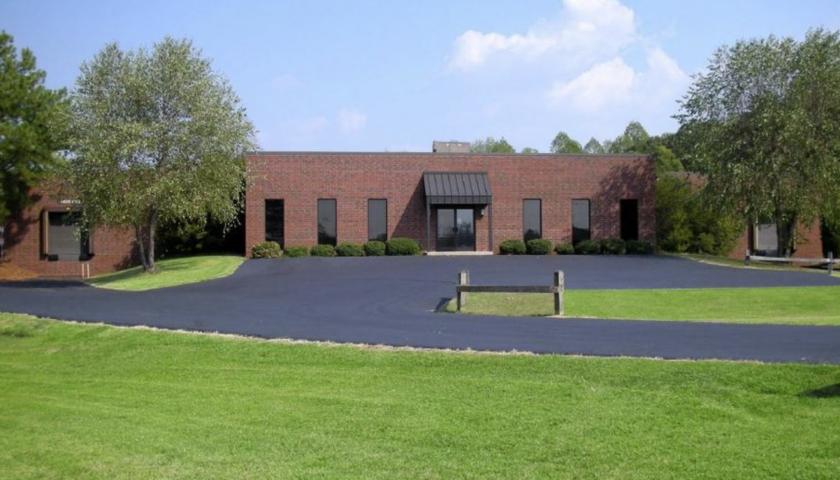
105 Forest Park Lane Thomasville, NC 27360
105 Forest Park Lane Thomasville, NC 27360
Details & Description
Property Highlights
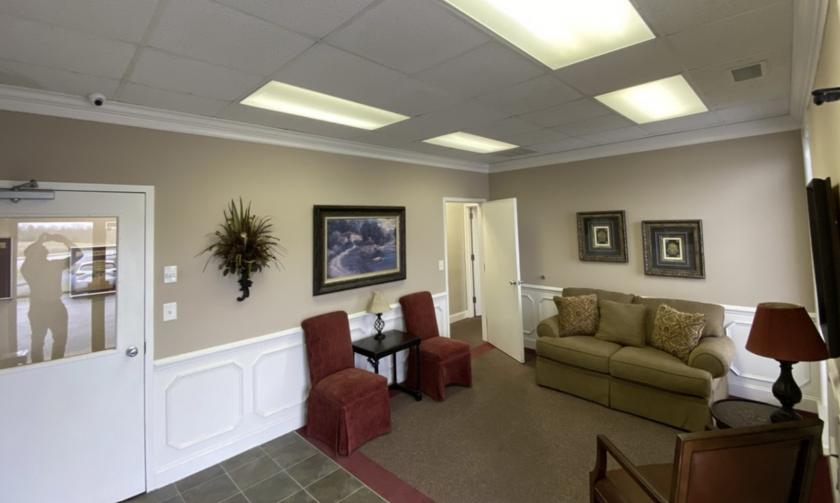
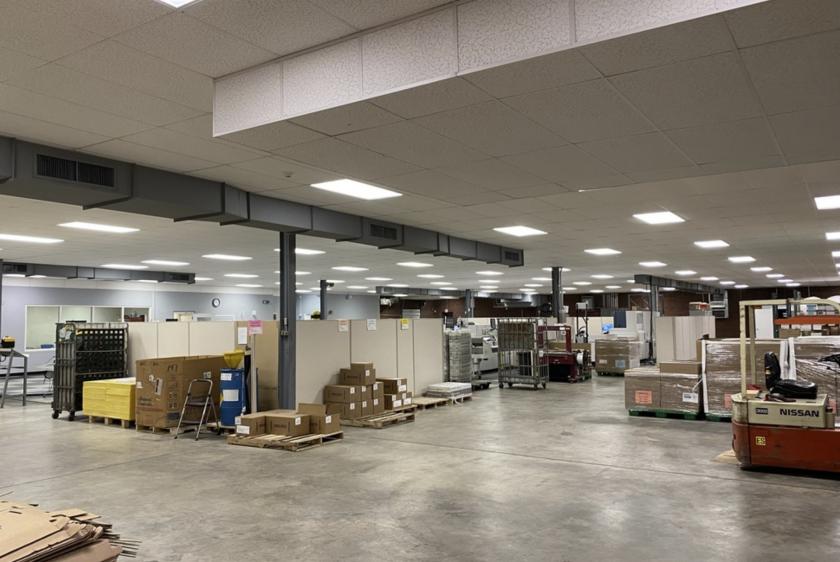
• Renovated office space that consist of a conference room, lobby, reception area, employee break room and private office
• Approximately 26 miles northeast from Piedmont Triad International Airport
Listing Agents

Thomas Hipp
O: 704-347-4676
thomas@whitesidecre.com
O: 704-347-4676
thomas@whitesidecre.com
While we strive to provide the most accurate information, all listing information, and demographic data, is provided by third-parties. As such, MyEListing will not be responsible for the accuracy of the information. It is strongly recommended that you verify all information with the listing agent, and any relevant agencies, prior to making any decisions.