Industrial Properties
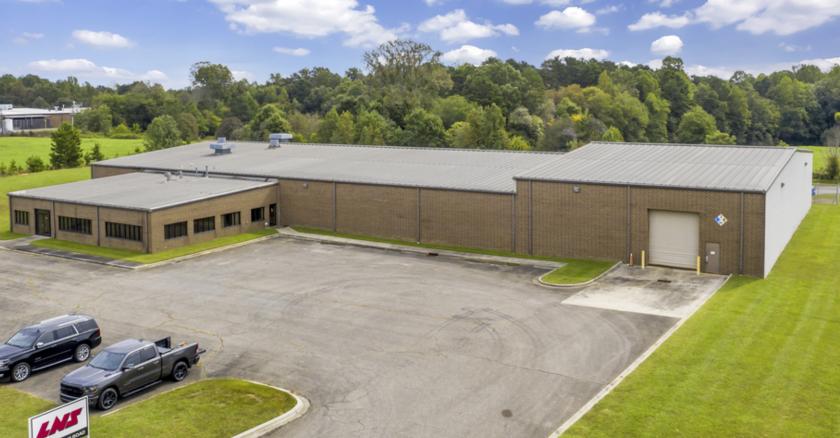
242 Dick Beam Road Cherryville, NC 28021
242 Dick Beam Road Cherryville, NC 28021
Details & Description
Property Highlights
• 16.5 clear at the eaves and 21.5 clear in the center of the 7,260 SF high crane bay portion below main beams
• 13 clear at the eaves and 17.5 clear at the center in the 22,385 SF section below main beams
Listing Agents

Thomas Hipp
O: 704-347-4676
thomas@whitesidecre.com
O: 704-347-4676
thomas@whitesidecre.com
While we strive to provide the most accurate information, all listing information, and demographic data, is provided by third-parties. As such, MyEListing will not be responsible for the accuracy of the information. It is strongly recommended that you verify all information with the listing agent, and any relevant agencies, prior to making any decisions.


